## Bar Chart: Feature Comparison of Language Models
### Overview
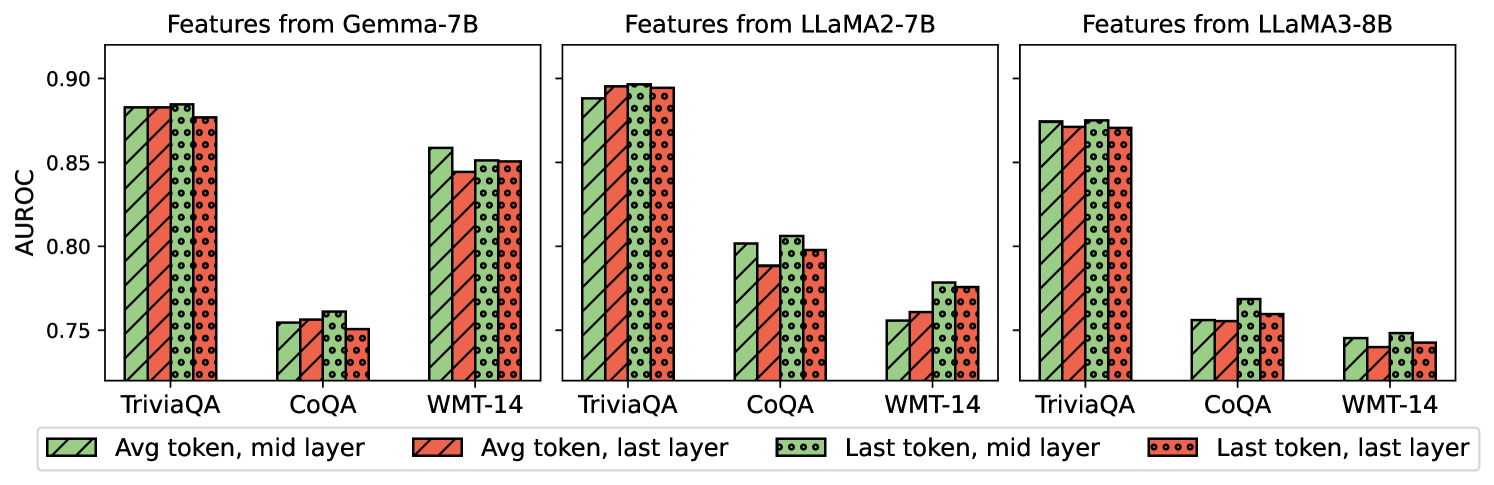
The image presents a set of bar charts comparing the performance of three language models (Gemma-7B, LLaMA2-7B, and LLaMA3-8B) on three different tasks (TriviaQA, CoQA, and WMT-14). The performance metric used is AUROC (Area Under the Receiver Operating Characteristic curve). The charts compare the AUROC scores obtained using features extracted from different layers (mid and last) and token positions (average and last) within each model.
### Components/Axes
* **Title:** The image is composed of three sub-charts, each titled "Features from [Model Name]".
* Left Chart: "Features from Gemma-7B"
* Middle Chart: "Features from LLaMA2-7B"
* Right Chart: "Features from LLaMA3-8B"
* **Y-axis:** Labeled "AUROC" with a numerical scale ranging from 0.75 to 0.90, with tick marks at 0.75, 0.80, 0.85, and 0.90.
* **X-axis:** Categorical, representing the tasks: TriviaQA, CoQA, and WMT-14.
* **Legend:** Located at the bottom of the image.
* Green with diagonal lines: "Avg token, mid layer"
* Red with diagonal lines: "Avg token, last layer"
* Green with circles: "Last token, mid layer"
* Red with circles: "Last token, last layer"
### Detailed Analysis
**Gemma-7B:**
* **TriviaQA:**
* Avg token, mid layer (green, diagonal lines): ~0.87
* Avg token, last layer (red, diagonal lines): ~0.87
* Last token, mid layer (green, circles): ~0.87
* Last token, last layer (red, circles): ~0.87
* **CoQA:**
* Avg token, mid layer (green, diagonal lines): ~0.755
* Avg token, last layer (red, diagonal lines): ~0.75
* Last token, mid layer (green, circles): ~0.76
* Last token, last layer (red, circles): ~0.755
* **WMT-14:**
* Avg token, mid layer (green, diagonal lines): ~0.86
* Avg token, last layer (red, diagonal lines): ~0.85
* Last token, mid layer (green, circles): ~0.86
* Last token, last layer (red, circles): ~0.855
**LLaMA2-7B:**
* **TriviaQA:**
* Avg token, mid layer (green, diagonal lines): ~0.89
* Avg token, last layer (red, diagonal lines): ~0.89
* Last token, mid layer (green, circles): ~0.895
* Last token, last layer (red, circles): ~0.895
* **CoQA:**
* Avg token, mid layer (green, diagonal lines): ~0.80
* Avg token, last layer (red, diagonal lines): ~0.79
* Last token, mid layer (green, circles): ~0.805
* Last token, last layer (red, circles): ~0.80
* **WMT-14:**
* Avg token, mid layer (green, diagonal lines): ~0.76
* Avg token, last layer (red, diagonal lines): ~0.755
* Last token, mid layer (green, circles): ~0.77
* Last token, last layer (red, circles): ~0.76
**LLaMA3-8B:**
* **TriviaQA:**
* Avg token, mid layer (green, diagonal lines): ~0.86
* Avg token, last layer (red, diagonal lines): ~0.855
* Last token, mid layer (green, circles): ~0.86
* Last token, last layer (red, circles): ~0.855
* **CoQA:**
* Avg token, mid layer (green, diagonal lines): ~0.76
* Avg token, last layer (red, diagonal lines): ~0.755
* Last token, mid layer (green, circles): ~0.76
* Last token, last layer (red, circles): ~0.755
* **WMT-14:**
* Avg token, mid layer (green, diagonal lines): ~0.745
* Avg token, last layer (red, diagonal lines): ~0.74
* Last token, mid layer (green, circles): ~0.75
* Last token, last layer (red, circles): ~0.745
### Key Observations
* For all models, performance on TriviaQA is generally the highest, followed by WMT-14, and then CoQA.
* The choice of layer (mid vs. last) and token position (average vs. last) has a relatively small impact on the AUROC score compared to the choice of task.
* LLaMA2-7B generally achieves the highest AUROC scores across all tasks and feature extraction methods.
* Gemma-7B and LLaMA3-8B show similar performance patterns, with LLaMA3-8B slightly underperforming on WMT-14.
### Interpretation
The bar charts provide a comparative analysis of the performance of three language models on different tasks, using AUROC as the evaluation metric. The data suggests that the LLaMA2-7B model is the most effective among the three, achieving the highest AUROC scores across the tasks. The performance differences between using the average token versus the last token, and the mid layer versus the last layer, are relatively minor, indicating that the overall model architecture and training data have a more significant impact on performance than these specific feature extraction choices. The lower performance on CoQA across all models suggests that this task is more challenging for these models compared to TriviaQA and WMT-14.