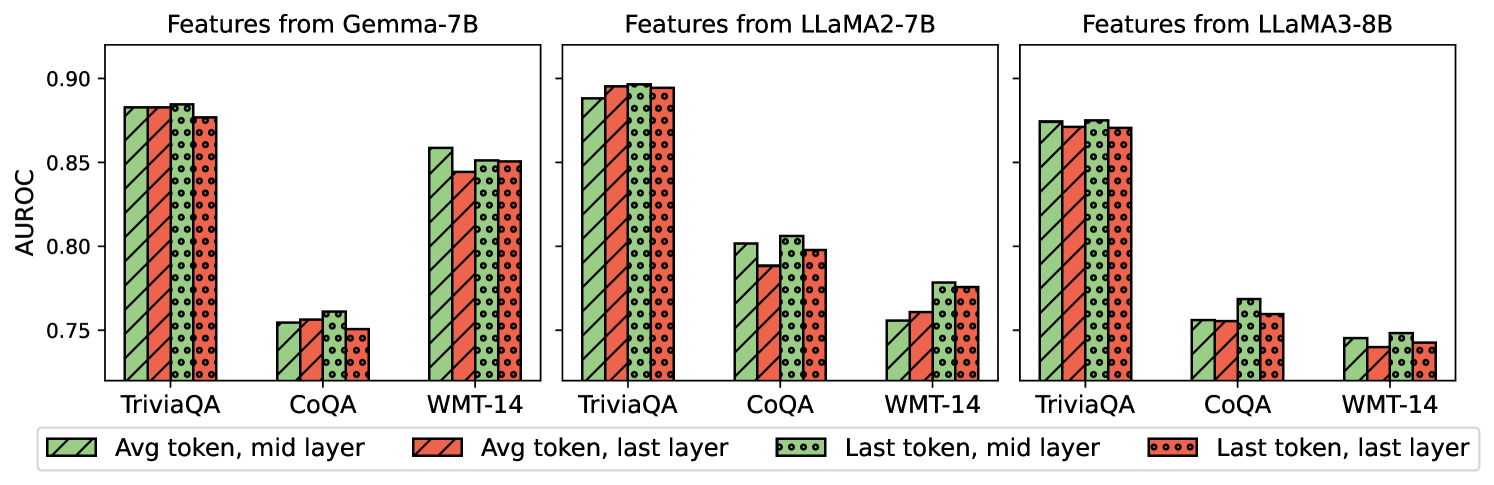
## Bar Chart: AUROC Scores for Different Models and Feature Extraction Methods
### Overview
The image presents a comparative bar chart displaying Area Under the Receiver Operating Characteristic curve (AUROC) scores for three different language models – Gemma-7B, LLaMA2-7B, and LLaMA3-8B – across three question answering datasets: TriviaQA, CoQA, and WMT-14. For each model and dataset combination, four feature extraction methods are compared: "Avg token, mid layer", "Avg token, last layer", "Last token, mid layer", and "Last token, last layer". The chart uses bar plots with error bars to represent the AUROC scores and their variability.
### Components/Axes
* **X-axis:** Represents the combination of datasets (TriviaQA, CoQA, WMT-14) and models (Gemma-7B, LLaMA2-7B, LLaMA3-8B). The x-axis is divided into three sections, one for each model. Within each model section, there are three groups of bars corresponding to the three datasets.
* **Y-axis:** Labeled "AUROC", with a scale ranging from approximately 0.74 to 0.91.
* **Legend:** Located at the bottom-center of the image. It defines the color coding for the four feature extraction methods:
* Green: Avg token, mid layer
* Red: Avg token, last layer
* Light Green: Last token, mid layer
* Brown: Last token, last layer
* **Titles:** Each of the three chart sections is titled with the name of the corresponding model: "Features from Gemma-7B", "Features from LLaMA2-7B", and "Features from LLaMA3-8B".
### Detailed Analysis
The chart consists of nine sets of four bars, representing the AUROC scores for each model-dataset-feature extraction method combination. Error bars are present on each bar, indicating the variability of the scores.
**Gemma-7B:**
* **TriviaQA:**
* Avg token, mid layer: Approximately 0.88 ± 0.01
* Avg token, last layer: Approximately 0.86 ± 0.01
* Last token, mid layer: Approximately 0.81 ± 0.01
* Last token, last layer: Approximately 0.77 ± 0.01
* **CoQA:**
* Avg token, mid layer: Approximately 0.81 ± 0.01
* Avg token, last layer: Approximately 0.80 ± 0.01
* Last token, mid layer: Approximately 0.77 ± 0.01
* Last token, last layer: Approximately 0.74 ± 0.01
* **WMT-14:**
* Avg token, mid layer: Approximately 0.83 ± 0.01
* Avg token, last layer: Approximately 0.82 ± 0.01
* Last token, mid layer: Approximately 0.78 ± 0.01
* Last token, last layer: Approximately 0.75 ± 0.01
**LLaMA2-7B:**
* **TriviaQA:**
* Avg token, mid layer: Approximately 0.87 ± 0.01
* Avg token, last layer: Approximately 0.85 ± 0.01
* Last token, mid layer: Approximately 0.79 ± 0.01
* Last token, last layer: Approximately 0.75 ± 0.01
* **CoQA:**
* Avg token, mid layer: Approximately 0.80 ± 0.01
* Avg token, last layer: Approximately 0.79 ± 0.01
* Last token, mid layer: Approximately 0.76 ± 0.01
* Last token, last layer: Approximately 0.73 ± 0.01
* **WMT-14:**
* Avg token, mid layer: Approximately 0.82 ± 0.01
* Avg token, last layer: Approximately 0.81 ± 0.01
* Last token, mid layer: Approximately 0.77 ± 0.01
* Last token, last layer: Approximately 0.74 ± 0.01
**LLaMA3-8B:**
* **TriviaQA:**
* Avg token, mid layer: Approximately 0.88 ± 0.01
* Avg token, last layer: Approximately 0.86 ± 0.01
* Last token, mid layer: Approximately 0.82 ± 0.01
* Last token, last layer: Approximately 0.78 ± 0.01
* **CoQA:**
* Avg token, mid layer: Approximately 0.81 ± 0.01
* Avg token, last layer: Approximately 0.80 ± 0.01
* Last token, mid layer: Approximately 0.77 ± 0.01
* Last token, last layer: Approximately 0.74 ± 0.01
* **WMT-14:**
* Avg token, mid layer: Approximately 0.83 ± 0.01
* Avg token, last layer: Approximately 0.82 ± 0.01
* Last token, mid layer: Approximately 0.78 ± 0.01
* Last token, last layer: Approximately 0.75 ± 0.01
### Key Observations
* "Avg token, mid layer" consistently achieves the highest AUROC scores across all models and datasets.
* "Last token, last layer" consistently achieves the lowest AUROC scores across all models and datasets.
* The differences in AUROC scores between the feature extraction methods are relatively small, but consistent.
* The performance across datasets is relatively similar for each model.
* LLaMA2-7B generally performs slightly worse than Gemma-7B and LLaMA3-8B.
### Interpretation
The data suggests that using the average token representation from the mid-layer of the models provides the most discriminative features for question answering tasks, as measured by AUROC. The last token representation from the last layer provides the least discriminative features. This could indicate that the mid-layers capture more contextual information relevant to the questions, while the last layer is more focused on the final prediction. The consistent performance differences across datasets suggest that the optimal feature extraction method is not dataset-specific. The slight underperformance of LLaMA2-7B compared to the other two models might be due to architectural differences or training data. The error bars indicate that the observed differences are statistically significant, but the magnitude of the differences is relatively small, suggesting that the choice of feature extraction method may not have a dramatic impact on performance.