TECHNICAL ASSET FINGERPRINT
ed5edab4264c83925ac4a808
Click to view fullscreen
Press ESC or click to close
FOUND IN PAPERS
EXPERT: healer-alpha-free VERSION 1
RUNTIME: free/openrouter/healer-alpha
INTEL_VERIFIED
## Bar Chart: AUROC Performance of Feature Extraction Methods Across Language Models and Datasets
### Overview
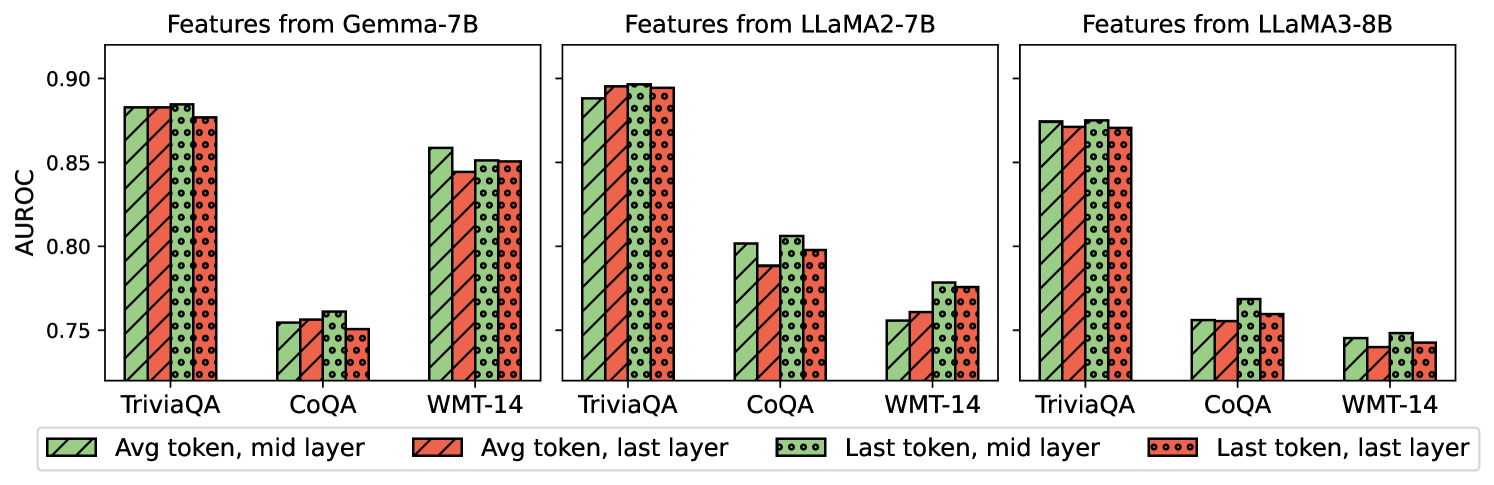
The image is a multi-panel bar chart comparing the AUROC (Area Under the Receiver Operating Characteristic curve) performance of four different feature extraction methods. The comparison is conducted across three benchmark datasets (TriviaQA, CoQA, WMT-14) and for features derived from three different large language models: Gemma-7B, LLaMA2-7B, and LLaMA3-8B.
### Components/Axes
* **Chart Type:** Grouped Bar Chart (3 subplots).
* **Y-Axis:** Labeled **AUROC**. The scale runs from 0.75 to 0.90, with major tick marks at 0.75, 0.80, 0.85, and 0.90.
* **X-Axis (per subplot):** Three categorical datasets: **TriviaQA**, **CoQA**, **WMT-14**.
* **Subplot Titles (Top):**
1. **Features from Gemma-7B** (Left panel)
2. **Features from LLaMA2-7B** (Center panel)
3. **Features from LLaMA3-8B** (Right panel)
* **Legend (Bottom Center):** Defines four bar styles, each representing a feature extraction method:
1. **Avg token, mid layer:** Green bar with diagonal hatching (\\).
2. **Avg token, last layer:** Red bar with diagonal hatching (\\).
3. **Last token, mid layer:** Green bar with a dotted pattern.
4. **Last token, last layer:** Red bar with a dotted pattern.
### Detailed Analysis
**Trend Verification & Data Points (Approximate AUROC values):**
**1. Features from Gemma-7B (Left Panel):**
* **TriviaQA:** All four methods perform very similarly and highly, clustered around **0.88 - 0.89**. The "Last token, mid layer" (green dotted) bar appears marginally highest.
* **CoQA:** Performance is significantly lower, clustered around **0.75 - 0.76**. The "Last token, mid layer" (green dotted) bar is again slightly higher than the others.
* **WMT-14:** Performance is intermediate, clustered around **0.85**. The "Avg token, mid layer" (green hatched) bar is the highest at ~0.86, while the "Avg token, last layer" (red hatched) is the lowest at ~0.845.
**2. Features from LLaMA2-7B (Center Panel):**
* **TriviaQA:** Very high performance, with all bars near or at **0.90**. The "Avg token, last layer" (red hatched) and "Last token, mid layer" (green dotted) bars appear to reach the 0.90 line.
* **CoQA:** Performance is moderate, ranging from **~0.79 to ~0.81**. The "Last token, mid layer" (green dotted) bar is the highest (~0.81), while the "Avg token, last layer" (red hatched) is the lowest (~0.79).
* **WMT-14:** Performance is the lowest for this model, ranging from **~0.755 to ~0.78**. The "Last token, mid layer" (green dotted) bar is the highest (~0.78), and the "Avg token, mid layer" (green hatched) is the lowest (~0.755).
**3. Features from LLaMA3-8B (Right Panel):**
* **TriviaQA:** High performance, clustered around **0.87 - 0.88**. The "Last token, mid layer" (green dotted) bar is the highest (~0.88).
* **CoQA:** Performance is moderate, ranging from **~0.755 to ~0.77**. The "Last token, mid layer" (green dotted) bar is the highest (~0.77).
* **WMT-14:** Performance is the lowest, clustered around **0.74 - 0.75**. The "Last token, mid layer" (green dotted) bar is the highest (~0.75), while the "Avg token, last layer" (red hatched) is the lowest (~0.74).
### Key Observations
1. **Dataset Hierarchy:** For all three models, performance is consistently highest on **TriviaQA**, intermediate on **CoQA** (for Gemma and LLaMA3) or **WMT-14** (for LLaMA2), and lowest on the remaining dataset.
2. **Model Comparison:** **LLaMA2-7B** achieves the highest peak performance (reaching ~0.90 on TriviaQA). **Gemma-7B** shows the most consistent performance across methods on a given dataset (bars are very close in height). **LLaMA3-8B** generally shows slightly lower AUROC scores than the other two models across most tasks.
3. **Feature Extraction Method:** The **"Last token, mid layer"** method (green dotted bar) is frequently the top or tied-for-top performer within each dataset group across all models. The **"Avg token, last layer"** method (red hatched bar) is often among the lowest performers.
4. **Layer vs. Token:** Using features from the **mid layer** (green bars) often yields a slight advantage over using the **last layer** (red bars), particularly when comparing the "Last token" variants. Using the **last token** (dotted bars) often yields a slight advantage over using the **average of all tokens** (hatched bars), particularly in the mid layer.
### Interpretation
This chart investigates how to best extract meaningful features from the internal representations of large language models (LLMs) for downstream evaluation (measured by AUROC). The data suggests several key insights:
* **Task Dependency:** The LLMs' internal features are not universally optimal. Their quality for detection/classification tasks (as measured by AUROC) is highly dependent on the nature of the benchmark dataset. TriviaQA, likely a factual recall task, yields the most discriminative features across all models.
* **Optimal Extraction Strategy:** There is a consistent, subtle advantage to extracting features from the **middle layers** of the model rather than the final layer. This aligns with the understanding that middle layers often capture rich, syntactic, and semantic information before it is overly specialized for the model's final language modeling objective. Furthermore, using the representation of the **last token** (often the delimiter or "answer" position in instruction-tuned models) appears more informative than averaging all token representations.
* **Model Evolution:** The comparison between LLaMA2-7B and LLaMA3-8B is particularly interesting. While LLaMA3 is a newer and generally more capable model, its extracted features for these specific tasks do not show a uniform improvement in AUROC over LLaMA2. This could indicate differences in model architecture, training data, or that "capability" and "feature quality for external evaluation" are not perfectly correlated.
* **Practical Implication:** For researchers using LLM features as detectors (e.g., for hallucination, toxicity, or output quality), the choice of layer and token is a meaningful hyperparameter. The "Last token, mid layer" configuration appears to be a robust starting point based on this evidence. The relatively small performance gaps, however, suggest that the features are somewhat robust to these extraction choices.
DECODING INTELLIGENCE...