## Histogram: Reward Distribution Comparison
### Overview
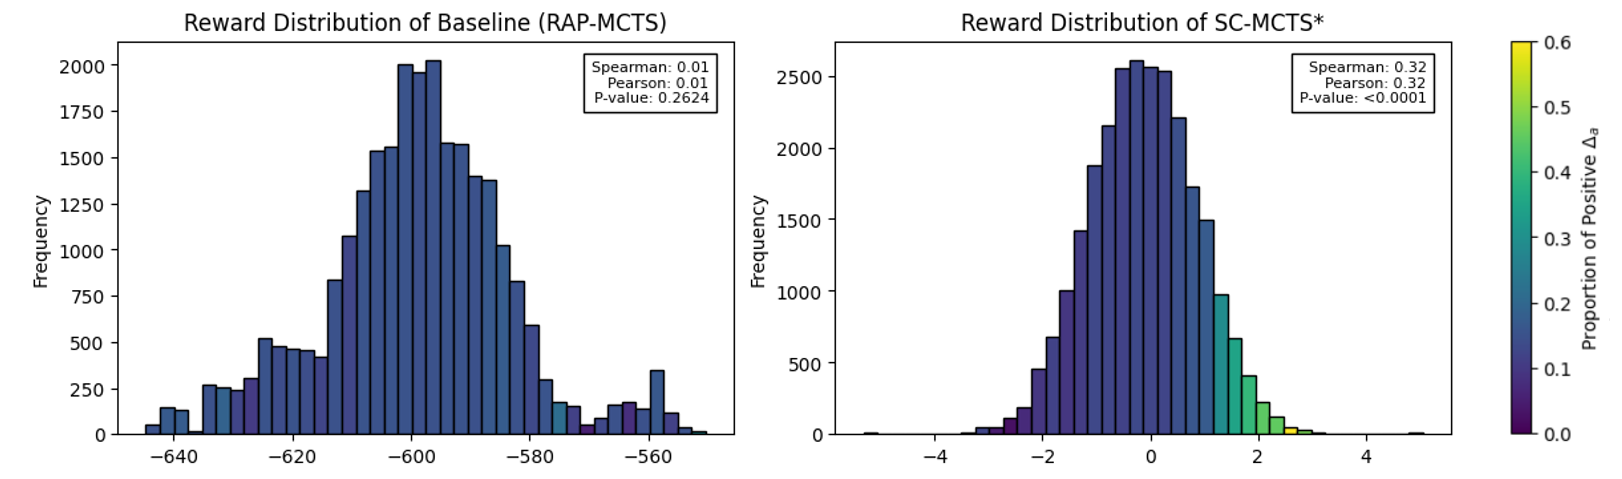
The image presents two histograms side-by-side, comparing the reward distributions of two different algorithms: Baseline (RAP-MCTS) and SC-MCTS*. The histograms are color-coded to represent the proportion of positive Δa.
### Components/Axes
**Left Histogram (Baseline RAP-MCTS):**
* **Title:** Reward Distribution of Baseline (RAP-MCTS)
* **X-axis:** Reward (values ranging from approximately -640 to -560)
* **Y-axis:** Frequency (values ranging from 0 to 2000)
* **Statistical Information:**
* Spearman: 0.01
* Pearson: 0.01
* P-value: 0.2624
**Right Histogram (SC-MCTS*):**
* **Title:** Reward Distribution of SC-MCTS*
* **X-axis:** Reward (values ranging from approximately -4 to 4)
* **Y-axis:** Frequency (values ranging from 0 to 2500)
* **Statistical Information:**
* Spearman: 0.32
* Pearson: 0.32
* P-value: <0.0001
**Color Bar (Proportion of Positive Δa):**
* **Label:** Proportion of Positive Δa
* **Scale:** Ranges from 0.0 to 0.6, with color gradient from dark blue to yellow.
### Detailed Analysis
**Left Histogram (Baseline RAP-MCTS):**
* The distribution is centered around -595, with a primary peak at approximately 1900 frequency.
* The distribution has a long tail towards lower reward values (left side).
* There's a secondary, smaller peak around -560 with a frequency of approximately 300.
* The bars are colored according to the proportion of positive Δa, but the color variation is minimal, mostly dark blue.
**Right Histogram (SC-MCTS*):**
* The distribution is centered around 0, with a peak at approximately 2500 frequency.
* The distribution is more symmetrical compared to the Baseline.
* The bars show a color gradient, with blue bars around the center and green/yellow bars towards the right (positive reward values).
* At reward value of 2, the frequency is approximately 250, and the color is green, corresponding to a proportion of positive Δa of approximately 0.4.
### Key Observations
* The SC-MCTS* algorithm has a reward distribution that is centered around 0, indicating better performance compared to the Baseline.
* The Baseline algorithm's reward distribution is centered around -595, indicating lower performance.
* The p-value for SC-MCTS* is <0.0001, indicating a statistically significant result.
* The p-value for Baseline is 0.2624, indicating a non-significant result.
* The color gradient in the SC-MCTS* histogram shows that higher reward values are associated with a higher proportion of positive Δa.
### Interpretation
The histograms compare the reward distributions of two algorithms, Baseline (RAP-MCTS) and SC-MCTS*. The SC-MCTS* algorithm demonstrates a significantly better reward distribution, centered around 0, with a statistically significant p-value. This suggests that SC-MCTS* is a more effective algorithm compared to the Baseline. The color gradient in the SC-MCTS* histogram further indicates that higher reward values are associated with a higher proportion of positive Δa, reinforcing the algorithm's superior performance. The Baseline algorithm, on the other hand, has a reward distribution centered around -595 and a non-significant p-value, indicating lower performance.