\n
## Histograms: Reward Distribution of Baseline (RAP-MCTS) and SC-MCTS*
### Overview
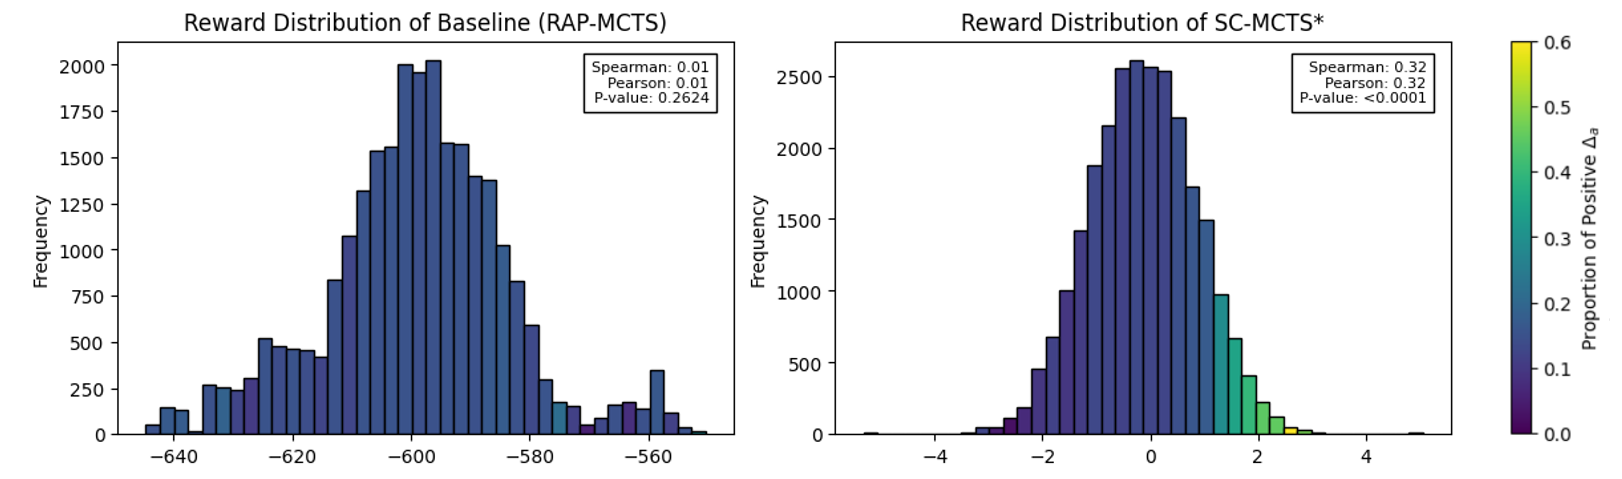
The image presents two histograms displaying reward distributions for two different algorithms: Baseline (RAP-MCTS) and SC-MCTS*. Both histograms are overlaid with a color gradient representing the proportion of positive A<sub>α</sub> values. Each histogram also includes Spearman and Pearson correlation coefficients with associated p-values.
### Components/Axes
* **X-axis (Left Histogram):** Reward values ranging approximately from -640 to -560.
* **X-axis (Right Histogram):** Reward values ranging approximately from -4 to 4.
* **Y-axis (Both Histograms):** Frequency, ranging from 0 to 2000+.
* **Color Gradient (Both Histograms):** Represents the proportion of positive A<sub>α</sub>, ranging from 0.0 (purple) to 0.6 (green). A legend is present in the top-right corner of the right histogram.
* **Title (Left Histogram):** "Reward Distribution of Baseline (RAP-MCTS)"
* **Title (Right Histogram):** "Reward Distribution of SC-MCTS*"
* **Correlation Statistics (Both Histograms):**
* Spearman: 0.01 (Left) / 0.32 (Right)
* Pearson: 0.01 (Left) / 0.32 (Right)
* P-value: 0.2624 (Left) / <0.0001 (Right)
### Detailed Analysis or Content Details
**Left Histogram (Baseline - RAP-MCTS):**
The histogram is approximately bell-shaped, but with a slight skew towards the left (negative reward values). The peak frequency is around 1900, occurring at a reward value of approximately -590. The distribution is relatively narrow, with most rewards falling between -630 and -560. The color gradient shows a predominantly purple hue, indicating a low proportion of positive A<sub>α</sub> values.
* **Approximate Data Points (Peak):** (-590, 1900)
* **Approximate Data Points (Left Tail):** (-640, 200), (-630, 300)
* **Approximate Data Points (Right Tail):** (-560, 250)
**Right Histogram (SC-MCTS*):**
This histogram is more symmetrical and centered around 0. The peak frequency is around 2200, occurring at a reward value of approximately 0. The distribution is wider than the baseline histogram, with rewards ranging from -4 to 4. The color gradient shows a mix of purple, blue, and green, indicating a higher proportion of positive A<sub>α</sub> values, particularly around the peak.
* **Approximate Data Points (Peak):** (0, 2200)
* **Approximate Data Points (Left Tail):** (-4, 300), (-2, 800)
* **Approximate Data Points (Right Tail):** (2, 800), (4, 300)
### Key Observations
* The Baseline (RAP-MCTS) histogram shows a distribution of predominantly negative rewards.
* The SC-MCTS* histogram shows a distribution centered around zero, with a more balanced representation of positive and negative rewards.
* The p-value for the SC-MCTS* correlation is significantly lower (<0.0001) than for the Baseline (0.2624), suggesting a stronger correlation.
* The Spearman and Pearson correlation coefficients are low for the Baseline (0.01) but higher for SC-MCTS* (0.32).
* The color gradient indicates that positive A<sub>α</sub> values are more prevalent in the SC-MCTS* distribution, particularly around the peak reward value.
### Interpretation
The data suggests that the SC-MCTS* algorithm performs better than the Baseline (RAP-MCTS) in terms of reward distribution. The SC-MCTS* algorithm generates a wider range of rewards, including a significant number of positive rewards, while the Baseline algorithm consistently produces negative rewards. The lower p-value and higher correlation coefficients for SC-MCTS* indicate a stronger relationship between the reward and the proportion of positive A<sub>α</sub> values. The color gradient visually reinforces this observation, showing a higher concentration of green (positive A<sub>α</sub>) around the peak reward value for SC-MCTS*.
The difference in reward distributions could be attributed to the specific mechanisms of each algorithm. The Baseline algorithm may be more prone to getting stuck in suboptimal solutions, resulting in consistently negative rewards. The SC-MCTS* algorithm, on the other hand, appears to be more effective at exploring the solution space and identifying rewarding actions. The A<sub>α</sub> values likely represent a measure of confidence or desirability, and the correlation suggests that the algorithm is more likely to select actions with higher A<sub>α</sub> values when it receives positive rewards.