\n
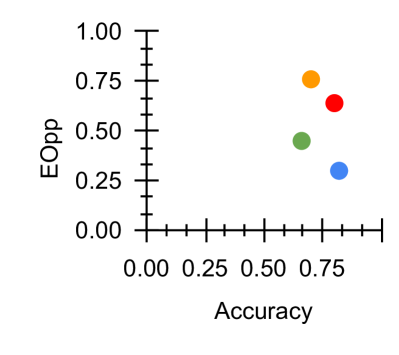
## Scatter Plot: Accuracy vs. EOpp
### Overview
This image presents a scatter plot visualizing the relationship between "Accuracy" and "EOpp" (presumably, Equal Opportunity). The plot displays five data points, each represented by a colored circle. The x-axis represents Accuracy, ranging from 0.00 to 0.75, and the y-axis represents EOpp, ranging from 0.00 to 1.00.
### Components/Axes
* **X-axis:** "Accuracy" - Scale ranges from 0.00 to 0.75, with tick marks at 0.00, 0.25, 0.50, and 0.75.
* **Y-axis:** "EOpp" - Scale ranges from 0.00 to 1.00, with tick marks at 0.00, 0.25, 0.50, 0.75, and 1.00.
* **Data Points:** Five colored circles, each representing a single data observation. No explicit legend is provided, so colors are used to differentiate the points.
### Detailed Analysis
The data points are distributed across the plot as follows:
* **Blue Circle:** Located at approximately (0.75, 0.25).
* **Green Circle:** Located at approximately (0.50, 0.45).
* **Red Circle:** Located at approximately (0.75, 0.65).
* **Orange Circle:** Located at approximately (0.75, 0.75).
* **Yellow Circle:** Located at approximately (0.50, 0.50).
There is no clear linear trend. The points are scattered, suggesting a weak or non-linear relationship between Accuracy and EOpp.
### Key Observations
* The highest EOpp value (approximately 0.75) is associated with an Accuracy of 0.75 (Orange Circle).
* The lowest EOpp value (approximately 0.25) is associated with an Accuracy of 0.75 (Blue Circle).
* Accuracy values range from 0.50 to 0.75.
* EOpp values range from 0.25 to 0.75.
### Interpretation
The scatter plot suggests that there isn't a strong, direct correlation between Accuracy and Equal Opportunity (EOpp) in the observed data. While higher accuracy *can* be associated with higher EOpp (as seen with the orange point), it's not a consistent pattern. The blue and red points, both with an accuracy of 0.75, demonstrate significantly different EOpp values. This could indicate that other factors influence EOpp beyond just the overall accuracy of a model or system.
The lack of a clear trend suggests that optimizing for accuracy alone may not necessarily lead to improved fairness (as measured by EOpp). Further investigation would be needed to understand the underlying reasons for this relationship and identify strategies for achieving both high accuracy and high EOpp simultaneously. The data points are sparse, so drawing definitive conclusions is limited. More data points would be needed to establish a more robust understanding of the relationship between these two metrics.