\n
## Diagram: Abduction in Neural Networks
### Overview
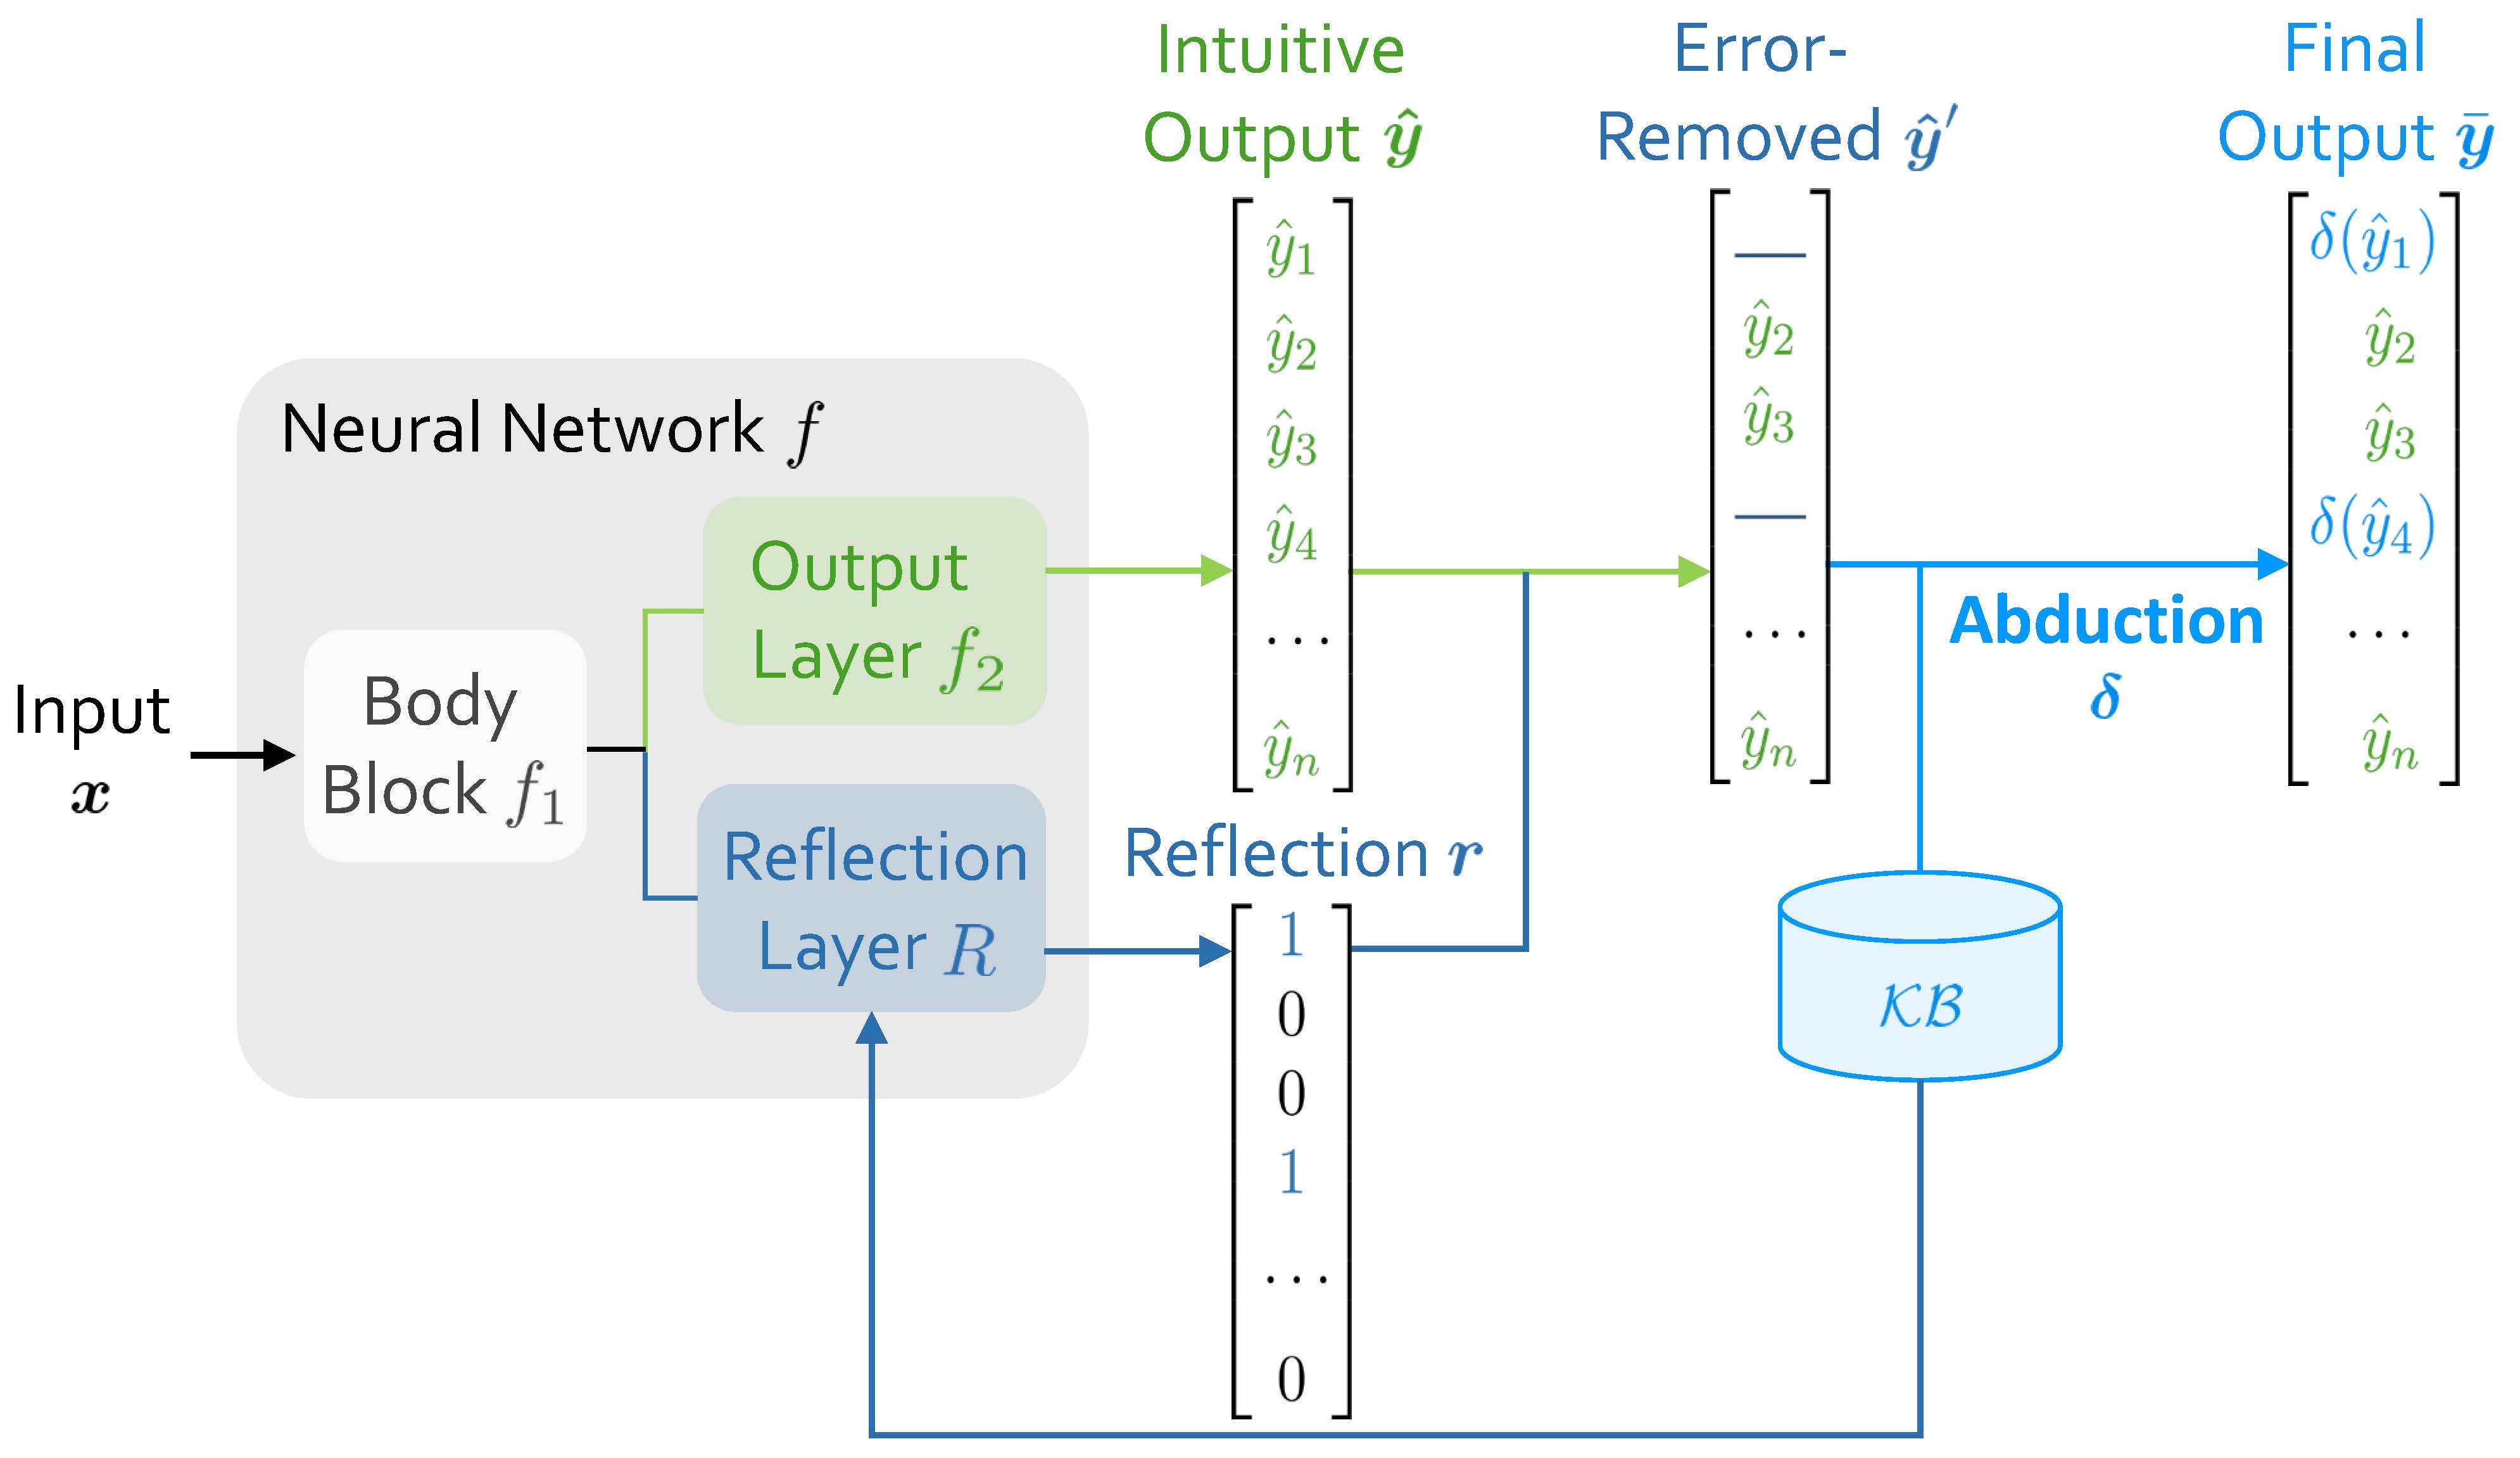
This diagram illustrates a process of abduction within a neural network framework. It depicts how an input 'x' is processed through a neural network 'f', and how a reflection layer 'R' and knowledge base 'KB' are used to refine the output through an abduction process, resulting in a final output 'ŷ'. The diagram highlights the iterative refinement of the output based on a reflection and error removal process.
### Components/Axes
The diagram consists of the following components:
* **Input (x):** The initial input to the neural network.
* **Neural Network (f):** Represented as a light gray rounded rectangle, containing two layers:
* **Body Block (f1):** The core processing unit of the network.
* **Output Layer (f2):** The layer producing the initial output.
* **Reflection Layer (R):** A green component that generates a reflection 'r' of the network's output.
* **Intuitive Output (ŷ):** A column vector representing the initial output of the neural network, labeled with ŷ1, ŷ2, ŷ3, ŷ4, and continuing to ŷn.
* **Error-Removed Output (ĝ):** A column vector representing the output after error removal, labeled with ŷ2, ŷ3, ŷ4, and continuing to ŷn. A horizontal bar above ŷ2 indicates error removal.
* **Abduction (δ):** A teal-colored component representing the abduction process, taking the error-removed output and the knowledge base as input.
* **Knowledge Base (KB):** A light blue rectangle representing the knowledge base used in the abduction process.
* **Final Output (ŷ):** A column vector representing the final output after abduction, labeled with ŷ2, ŷ3, ŷ4, and continuing to ŷn. δ(ŷ4) is specifically noted.
* **Reflection (r):** A column vector representing the reflection generated by the Reflection Layer, with values alternating between 1 and 0, continuing in a similar pattern.
### Detailed Analysis or Content Details
The diagram shows a flow of information:
1. **Input (x)** enters the **Neural Network (f)**.
2. The **Body Block (f1)** processes the input.
3. The **Output Layer (f2)** produces an **Intuitive Output (ŷ)**, represented as a column vector with elements ŷ1 to ŷn.
4. The **Reflection Layer (R)** generates a **Reflection (r)**, a column vector with alternating 1s and 0s.
5. The **Intuitive Output (ŷ)** is passed to the **Error-Removed Output (ĝ)**, where an error is removed from ŷ2.
6. The **Error-Removed Output (ĝ)** and the **Knowledge Base (KB)** are fed into the **Abduction (δ)** process.
7. The **Abduction (δ)** process refines the output, specifically noted as δ(ŷ4).
8. The **Final Output (ŷ)** is produced, a column vector with elements ŷ2 to ŷn.
The Reflection (r) vector has the following values as shown:
1
0
1
0
...
0
The Intuitive Output (ŷ) vector has the following values as shown:
ŷ1
ŷ2
ŷ3
ŷ4
...
ŷn
The Error-Removed Output (ĝ) vector has the following values as shown:
ŷ2
ŷ3
ŷ4
...
ŷn
The Final Output (ŷ) vector has the following values as shown:
ŷ2
ŷ3
ŷ4
...
ŷn
### Key Observations
The diagram emphasizes the iterative refinement of the neural network's output through the abduction process. The reflection layer and knowledge base play crucial roles in this refinement. The specific notation δ(ŷ4) suggests that the abduction process may focus on refining specific elements of the output. The alternating 1 and 0 pattern in the Reflection (r) vector is notable and may represent a binary encoding or a specific type of feedback mechanism.
### Interpretation
This diagram illustrates a model for incorporating abductive reasoning into neural networks. Abduction, in this context, is the process of inferring the most likely explanation for an observation. The neural network provides an initial hypothesis (ŷ), the reflection layer generates a representation of the network's internal state (r), and the knowledge base (KB) provides background information. The abduction process (δ) then combines these elements to refine the hypothesis, resulting in a more accurate and reliable final output (ŷ). The diagram suggests a system where the network doesn't just predict, but also *reasons* about its predictions, leveraging external knowledge to improve its performance. The error removal step indicates a focus on correcting inaccuracies in the initial output. The diagram is a conceptual representation of a complex process and doesn't provide specific details about the algorithms or implementation used for each component.