## Bar Charts: Gemma 2 9B - Feature Ratings
### Overview
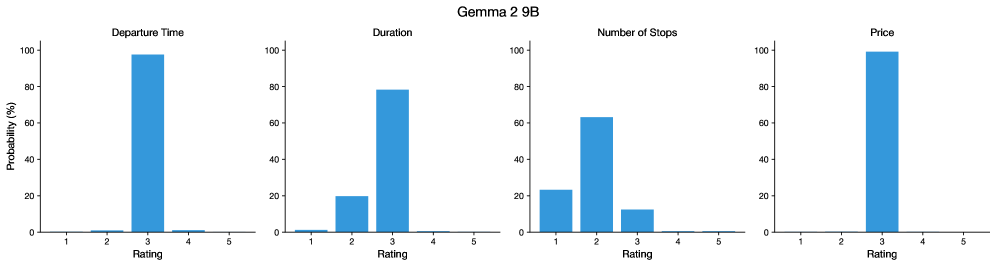
The image contains four bar charts arranged horizontally, each representing the distribution of ratings for a different feature: Departure Time, Duration, Number of Stops, and Price. The x-axis represents the rating (1 to 5), and the y-axis represents the probability in percentage (0 to 100%). All bars are blue. The title of the image is "Gemma 2 9B".
### Components/Axes
* **Title:** Gemma 2 9B (located at the top-center of the image)
* **X-axis (Rating):**
* Label: Rating
* Scale: 1, 2, 3, 4, 5 (same for all four charts)
* **Y-axis (Probability):**
* Label: Probability (%)
* Scale: 0, 20, 40, 60, 80, 100 (same for all four charts)
* **Chart Titles (from left to right):**
1. Departure Time
2. Duration
3. Number of Stops
4. Price
### Detailed Analysis
**1. Departure Time**
* Trend: The distribution is heavily skewed towards a rating of 3.
* Data Points:
* Rating 1: ~1%
* Rating 2: ~1%
* Rating 3: ~98%
* Rating 4: ~1%
* Rating 5: ~0%
**2. Duration**
* Trend: The distribution is skewed towards a rating of 3, with a secondary peak at 2.
* Data Points:
* Rating 1: ~1%
* Rating 2: ~20%
* Rating 3: ~78%
* Rating 4: ~1%
* Rating 5: ~0%
**3. Number of Stops**
* Trend: The distribution has peaks at ratings 1 and 2, with a smaller peak at 3.
* Data Points:
* Rating 1: ~23%
* Rating 2: ~63%
* Rating 3: ~13%
* Rating 4: ~1%
* Rating 5: ~0%
**4. Price**
* Trend: The distribution is heavily skewed towards a rating of 3.
* Data Points:
* Rating 1: ~0%
* Rating 2: ~0%
* Rating 3: ~100%
* Rating 4: ~0%
* Rating 5: ~0%
### Key Observations
* For Departure Time and Price, the rating is almost exclusively 3.
* Duration has a strong preference for rating 3, but also a significant number of ratings at 2.
* Number of Stops has a broader distribution, with peaks at ratings 1 and 2.
### Interpretation
The charts suggest that, for "Gemma 2 9B", the departure time and price are overwhelmingly rated as "3". Duration is also primarily rated as "3", but with a noticeable number of "2" ratings. The number of stops has a more varied distribution, indicating a wider range of experiences or preferences among users. The high concentration of ratings at "3" for Departure Time and Price could indicate a standardized or optimized aspect of the service, while the broader distribution for Number of Stops might reflect inherent variability in travel itineraries.