\n
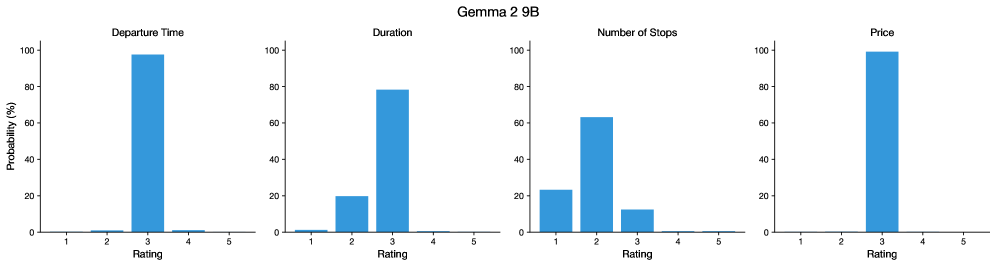
## Bar Charts: Probability Distributions for Travel Attributes
### Overview
The image presents four separate bar charts, arranged horizontally. Each chart displays a probability distribution for a different travel attribute: Departure Time, Duration, Number of Stops, and Price. The x-axis of each chart represents a "Rating" scale from 1 to 5, and the y-axis represents "Probability (%)" from 0 to 100. A title "Gemma 2 9B" is present above the charts.
### Components/Axes
* **Title:** Gemma 2 9B (positioned centrally above the four charts)
* **X-axis Label (all charts):** Rating
* **Y-axis Label (all charts):** Probability (%)
* **X-axis Scale (all charts):** 1, 2, 3, 4, 5
* **Y-axis Scale (all charts):** 0, 20, 40, 60, 80, 100
* **Chart 1:** Departure Time
* **Chart 2:** Duration
* **Chart 3:** Number of Stops
* **Chart 4:** Price
### Detailed Analysis
**Chart 1: Departure Time**
* The bar for Rating 3 is the highest, reaching approximately 95% probability.
* The bar for Rating 4 is also high, at approximately 95% probability.
* The bars for Ratings 1, 2, and 5 are very low, near 0% probability.
**Chart 2: Duration**
* The bar for Rating 3 is the highest, reaching approximately 80% probability.
* The bar for Rating 2 is approximately 20% probability.
* The bars for Ratings 1, 4, and 5 are very low, near 0% probability.
**Chart 3: Number of Stops**
* The bar for Rating 2 is the highest, reaching approximately 60% probability.
* The bar for Rating 3 is approximately 25% probability.
* The bar for Rating 1 is approximately 10% probability.
* The bars for Ratings 4 and 5 are very low, near 0% probability.
**Chart 4: Price**
* The bar for Rating 4 is the highest, reaching approximately 95% probability.
* The bar for Rating 5 is also high, at approximately 95% probability.
* The bars for Ratings 1, 2, and 3 are very low, near 0% probability.
### Key Observations
* Departure Time and Price have high probabilities concentrated at Ratings 3/4 and 4/5 respectively, indicating a preference for moderate to high values.
* Duration has a peak at Rating 3, suggesting a preference for moderate durations.
* Number of Stops has a peak at Rating 2, suggesting a preference for a small number of stops.
* Ratings 1 and 5 consistently have very low probabilities across all attributes, indicating these values are rarely observed.
### Interpretation
The data suggests a user preference profile for travel options. Users seem to prefer departure times and prices that are neither too low nor too high (ratings 3-5). They also prefer moderate durations and a small number of stops. The consistent low probability for ratings 1 and 5 across all attributes suggests that extremely low or high values for these features are undesirable. The "Gemma 2 9B" title suggests this data is related to a model or system named Gemma, potentially used for travel recommendations or analysis. The distributions are not normal, but rather heavily skewed towards specific rating values, indicating strong preferences. The data could be used to optimize travel recommendations by prioritizing options that align with these observed preferences.