## Bar Charts: Gamma 2 9B Ratings Distribution
### Overview
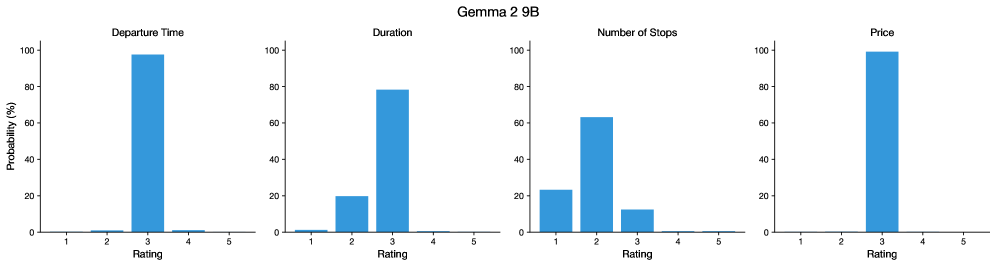
The image displays four side-by-side bar charts comparing user ratings (1-5) across four metrics: Departure Time, Duration, Number of Stops, and Price. All charts use a y-axis labeled "Probability (%)" (0-100) and x-axis labeled "Rating" (1-5). The charts show strong concentration of ratings at specific points, with minimal distribution across other values.
### Components/Axes
- **Main Title**: "Gamma 2 9B" (center top)
- **Y-Axes**: All charts share identical y-axis:
- Label: "Probability (%)"
- Scale: 0-100 in 20% increments
- **X-Axes**: All charts share identical x-axis:
- Label: "Rating"
- Categories: 1, 2, 3, 4, 5
- **Legend**: Not present
- **Bar Colors**: All bars use blue fill with white text labels
### Detailed Analysis
1. **Departure Time**
- Rating 3: ~98% probability (tallest bar)
- Ratings 2 & 4: ~1% each (tiny bars)
- Ratings 1 & 5: 0%
2. **Duration**
- Rating 3: ~78% probability
- Rating 2: ~20% probability
- Ratings 1, 4, 5: 0-1%
3. **Number of Stops**
- Rating 2: ~62% probability (tallest bar)
- Rating 3: ~12% probability
- Ratings 1, 4, 5: 0-1%
4. **Price**
- Rating 3: ~98% probability (tallest bar)
- Ratings 1-2, 4-5: 0%
### Key Observations
- **Dominance of Rating 3**: Three metrics (Departure Time, Duration, Price) show near-universal 3-star ratings
- **Bimodal Pattern**: Duration shows secondary peak at rating 2 (~20%)
- **Negative Correlation**: Number of Stops is the only metric with a dominant rating below 3 (rating 2)
- **Extreme Concentration**: All metrics show >90% of ratings clustered in single values
- **Missing Data**: No ratings recorded for 1, 4, or 5 in most metrics
### Interpretation
The data suggests users consistently rate these aspects of Gamma 2 9B at 3 stars, indicating moderate satisfaction. However, the Number of Stops metric deviates significantly, showing preference for fewer stops (rating 2). This could imply:
1. Users tolerate longer durations and higher prices if stops are minimized
2. The "3" rating may represent a neutral midpoint in their evaluation system
3. Potential data collection bias (e.g., only collecting ratings from specific user segments)
The extreme concentration of ratings suggests either:
- A highly standardized user experience
- Limited rating options available to users
- Possible data aggregation issues (e.g., rounding)
The absence of 1-2-4-5 ratings in most metrics raises questions about rating scale usage or data filtering criteria.