## Line Chart: Critic Score Mean vs. Step
### Overview
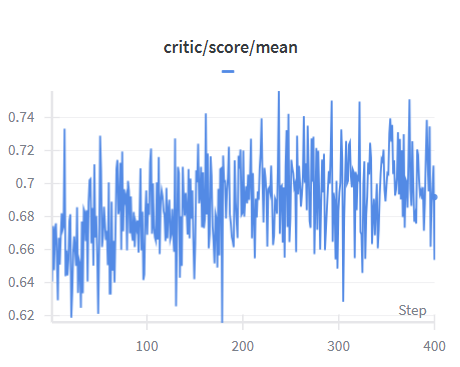
The image is a line chart showing the trend of the "critic/score/mean" over a series of steps. The chart displays fluctuations in the critic score mean, with an overall slight upward trend in the initial steps, followed by a relatively stable but volatile pattern.
### Components/Axes
* **Title:** critic/score/mean
* **X-axis:** Step, with markers at 0, 100, 200, 300, and 400.
* **Y-axis:** Numerical scale ranging from 0.62 to 0.74, with markers at 0.62, 0.64, 0.66, 0.68, 0.7, 0.72, and 0.74.
* **Legend:** A blue line represents the "critic/score/mean".
### Detailed Analysis
* **Data Series:** critic/score/mean (blue line)
* **Trend:** The blue line starts at approximately 0.65 at step 0. It generally increases to approximately 0.70 by step 100. From step 100 to 400, the line fluctuates between approximately 0.66 and 0.73, showing no clear upward or downward trend, but rather a volatile pattern.
* **Data Points:**
* Step 0: ~0.65
* Step 100: ~0.70
* Step 200: ~0.68
* Step 300: ~0.71
* Step 400: ~0.69
### Key Observations
* The critic score mean shows an initial increase in the first 100 steps.
* After the initial increase, the score fluctuates significantly, indicating variability in the critic's performance.
* There are no significant outliers, but the volatility remains consistent throughout the later steps.
### Interpretation
The chart suggests that the critic's performance, as measured by the score mean, improves initially during the first 100 steps. However, after this initial phase, the critic's performance becomes more variable, with no clear sustained improvement or decline. The fluctuations could be due to various factors, such as changes in the training data, exploration-exploitation trade-offs, or inherent instability in the learning process. The initial increase indicates a learning phase, while the subsequent fluctuations suggest a period of refinement or adaptation without significant overall progress.