\n
## Line Chart: critic/score/mean
### Overview
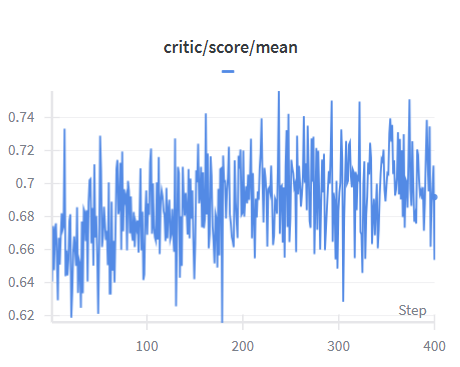
The image displays a line chart illustrating the trend of "critic/score/mean" over "Step". The chart shows a fluctuating line with values ranging approximately from 0.62 to 0.74. The chart appears to represent a time series or iterative process where the mean critic score is being tracked.
### Components/Axes
* **Title:** "critic/score/mean" positioned at the top-center.
* **Subtitle:** A single dash "-" positioned directly below the title.
* **X-axis:** Labeled "Step", ranging from approximately 0 to 400. The axis has tick marks at intervals of 100.
* **Y-axis:** Ranges from approximately 0.62 to 0.74. The axis has tick marks at intervals of 0.02.
* **Data Series:** A single blue line representing the "critic/score/mean".
* **Legend:** There is no explicit legend, as there is only one data series.
### Detailed Analysis
The blue line representing "critic/score/mean" exhibits a highly volatile pattern.
* **Initial Trend (Step 0-100):** The line starts at approximately 0.66 and fluctuates, generally trending slightly upwards.
* **Mid-Range (Step 100-300):** The line continues to fluctuate, with peaks reaching around 0.73 and troughs dipping to around 0.67. The fluctuations appear relatively consistent in amplitude.
* **Final Trend (Step 300-400):** The line continues to fluctuate, with a slight downward trend towards the end of the chart. The final value is approximately 0.69.
Approximate data points (sampled):
* Step 0: ~0.66
* Step 50: ~0.68
* Step 100: ~0.70
* Step 150: ~0.71
* Step 200: ~0.72
* Step 250: ~0.70
* Step 300: ~0.71
* Step 350: ~0.69
* Step 400: ~0.68
### Key Observations
* The data is highly noisy, with frequent and substantial fluctuations.
* There is no clear long-term trend, although there might be a very slight downward trend towards the end of the observed steps.
* The mean critic score appears to be consistently above 0.66 throughout the entire period.
* The maximum observed value is approximately 0.74, and the minimum is approximately 0.62.
### Interpretation
The chart suggests that the critic score is subject to significant variability. This could be due to a number of factors, such as the inherent subjectivity of criticism, changes in the criteria used for evaluation, or the influence of external events. The lack of a strong trend indicates that there is no consistent improvement or decline in the critic score over time. The consistent values above 0.66 suggest a generally positive reception, despite the fluctuations. The data could represent the evaluation of a creative work (e.g., a movie, a book, a game) over multiple iterations or reviews. The fluctuations might reflect different opinions or interpretations of the work. The slight downward trend at the end could indicate a potential decline in quality or a shift in critical sentiment, but further data would be needed to confirm this.