## Line Graph: critic/score/mean
### Overview
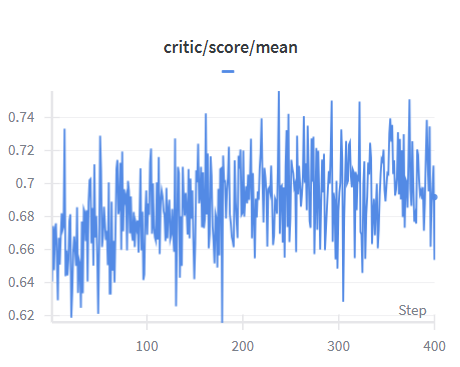
The image depicts a line graph titled "critic/score/mean" with a blue line representing data fluctuations over a series of steps. The y-axis ranges from 0.62 to 0.74, while the x-axis spans 0 to 400 steps. The line exhibits significant variability, with sharp peaks and troughs throughout the dataset.
### Components/Axes
- **Title**: "critic/score/mean" (centered at the top).
- **X-axis**: Labeled "Step," with values from 0 to 400 in increments of 100.
- **Y-axis**: Labeled "critic/score/mean," with grid lines at intervals of 0.02 (0.62, 0.64, 0.66, 0.68, 0.70, 0.72, 0.74).
- **Legend**: A single blue line labeled "critic/score/mean" (positioned near the top-right of the graph).
- **Gridlines**: Horizontal and vertical lines for reference.
### Detailed Analysis
- **Initial Trend (Steps 0–100)**: The line starts near 0.67 at step 0, rises sharply to ~0.74 by step 100, then drops to ~0.66 by step 150.
- **Mid-Range Fluctuations (Steps 150–300)**: The line oscillates between ~0.66 and ~0.72, with notable peaks at steps 200 (~0.73) and 250 (~0.71).
- **Final Segment (Steps 300–400)**: The line stabilizes slightly, ending near 0.69 at step 400 after a minor dip to ~0.67 at step 350.
### Key Observations
1. **High Variability**: The line exhibits frequent sharp peaks and troughs, suggesting instability or external influences.
2. **Peak at Step 100**: The highest value (~0.74) occurs early in the dataset.
3. **Trough at Step 200**: A significant dip to ~0.66 occurs midway through the dataset.
4. **No Clear Trend**: The line lacks a consistent upward or downward trajectory, indicating no long-term directional bias.
### Interpretation
The graph likely represents a metric (e.g., critic scores, mean performance) measured over discrete steps. The fluctuations suggest:
- **External Factors**: Variability could stem from changing conditions, interventions, or data collection inconsistencies.
- **Critical Thresholds**: Peaks and troughs may correspond to specific events or anomalies (e.g., system updates, user interactions).
- **Stability at End**: The final stabilization (~0.69) might indicate a return to baseline or resolution of prior variability.
The absence of a clear trend implies the metric is sensitive to external factors rather than following a deterministic pattern. Further analysis would require contextual data (e.g., step definitions, scoring criteria) to validate hypotheses.