## Line Chart: Average Accuracy vs. Training Step for Different 'n' Values
### Overview
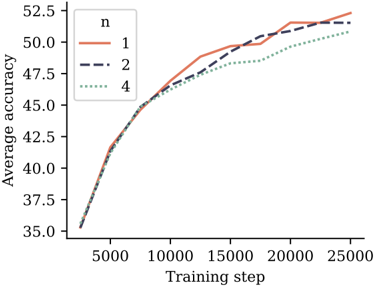
The image is a line chart showing the relationship between average accuracy and training step for three different values of 'n': 1, 2, and 4. The chart illustrates how the average accuracy changes as the training progresses for each 'n' value.
### Components/Axes
* **X-axis:** Training step, ranging from 0 to 25000 in increments of 5000.
* **Y-axis:** Average accuracy, ranging from 35.0 to 52.5 in increments of 2.5.
* **Legend:** Located in the top-left corner, indicating the 'n' values:
* n = 1 (solid red line)
* n = 2 (dashed black line)
* n = 4 (dotted green line)
### Detailed Analysis
* **n = 1 (solid red line):**
* Starts at approximately 35.0 accuracy at 0 training steps.
* Increases rapidly to approximately 46.0 accuracy by 10000 training steps.
* Continues to increase, reaching approximately 49.0 accuracy by 15000 training steps.
* Reaches approximately 51.0 accuracy by 20000 training steps.
* Plateaus around 52.0 accuracy by 25000 training steps.
* **n = 2 (dashed black line):**
* Starts at approximately 35.0 accuracy at 0 training steps.
* Increases rapidly to approximately 46.0 accuracy by 10000 training steps.
* Continues to increase, reaching approximately 48.5 accuracy by 15000 training steps.
* Reaches approximately 50.0 accuracy by 20000 training steps.
* Plateaus around 51.5 accuracy by 25000 training steps.
* **n = 4 (dotted green line):**
* Starts at approximately 35.0 accuracy at 0 training steps.
* Increases rapidly to approximately 46.0 accuracy by 10000 training steps.
* Continues to increase, reaching approximately 48.0 accuracy by 15000 training steps.
* Reaches approximately 49.0 accuracy by 20000 training steps.
* Plateaus around 50.5 accuracy by 25000 training steps.
### Key Observations
* All three lines start at the same accuracy level and increase rapidly in the initial training steps.
* The line representing n = 1 consistently achieves the highest average accuracy throughout the training process.
* The line representing n = 4 consistently achieves the lowest average accuracy throughout the training process.
* The lines converge as the training progresses, but the differences in accuracy remain noticeable.
* All three lines show a plateauing effect towards the end of the training, indicating diminishing returns.
### Interpretation
The chart suggests that the value of 'n' has a significant impact on the average accuracy achieved during training. A lower value of 'n' (n = 1) results in higher average accuracy compared to higher values (n = 2 and n = 4). This could be due to the specific algorithm or model being used, where a lower 'n' allows for better optimization or generalization. The plateauing effect indicates that increasing the training steps beyond a certain point does not significantly improve the average accuracy, suggesting that the model has reached its learning capacity for the given 'n' values. The data demonstrates that the choice of 'n' is a crucial parameter that needs to be carefully considered to optimize the model's performance.