## Line Graph: Average Accuracy vs Training Steps
### Overview
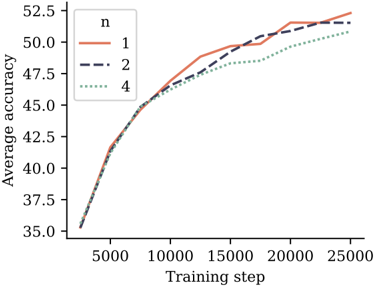
The image depicts a line graph illustrating the relationship between training steps and average accuracy for three distinct configurations (n=1, n=2, n=4). The graph shows three data series with varying line styles and colors, plotted against a Cartesian coordinate system.
### Components/Axes
- **X-axis (Horizontal)**: Labeled "Training step" with values ranging from 5,000 to 25,000 in increments of 5,000.
- **Y-axis (Vertical)**: Labeled "Average accuracy" with values ranging from 35.0 to 52.5 in increments of 2.5.
- **Legend**: Positioned in the top-left corner, containing three entries:
- Solid red line: `n = 1`
- Dashed blue line: `n = 2`
- Dotted green line: `n = 4`
### Detailed Analysis
1. **Data Series Trends**:
- **n = 1 (Solid Red)**: Starts at ~35.0 accuracy at 5,000 steps, rising sharply to ~52.5 accuracy by 25,000 steps. Maintains the highest accuracy throughout.
- **n = 2 (Dashed Blue)**: Begins at ~35.0 accuracy, follows a similar upward trajectory but plateaus slightly below n=1 (~51.0 accuracy at 25,000 steps).
- **n = 4 (Dotted Green)**: Starts at ~35.0 accuracy, exhibits the slowest growth, reaching ~50.5 accuracy at 25,000 steps.
2. **Key Data Points**:
- At 10,000 steps:
- n=1: ~47.5
- n=2: ~46.5
- n=4: ~45.5
- At 20,000 steps:
- n=1: ~51.5
- n=2: ~50.5
- n=4: ~49.0
### Key Observations
- All configurations show a consistent upward trend in accuracy as training steps increase.
- The gap between n=1 and n=4 narrows slightly over time but remains significant.
- n=1 consistently outperforms other configurations across all training steps.
### Interpretation
The data suggests that increasing the parameter `n` (likely representing model complexity, such as layers or neurons in a neural network) improves training accuracy. However, the diminishing returns for n=4 compared to n=1 and n=2 imply potential overfitting or diminishing benefits of excessive complexity. The convergence of n=2 and n=4 toward later training steps may indicate that beyond a certain threshold, additional complexity yields minimal gains. This aligns with common machine learning principles where optimal model complexity balances bias-variance tradeoffs.