## Diagram: Resource Allocation with Arms
### Overview
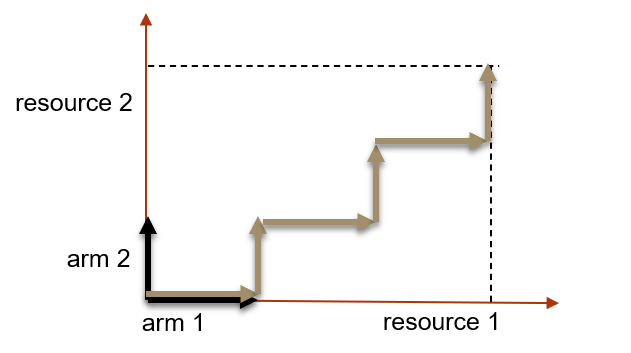
The image is a diagram illustrating a resource allocation strategy using two "arms" to acquire two resources. The diagram uses a 2D plane with axes representing "resource 1" and "resource 2". A stepped path, composed of horizontal and vertical segments with arrowheads, shows the incremental acquisition of resources. The path starts at the origin and moves towards the upper-right corner of an implied rectangular boundary.
### Components/Axes
* **X-axis:** Labeled "resource 1", with an arrow indicating direction.
* **Y-axis:** Labeled "resource 2", with an arrow indicating direction.
* **Origin:** The intersection of the x and y axes.
* **Arm 1:** A dark brown line segment along the x-axis, starting from the origin.
* **Arm 2:** A black line segment along the y-axis, starting from the origin.
* **Path:** A stepped path composed of alternating horizontal and vertical segments, each with an arrowhead indicating the direction of resource acquisition. The path is light brown.
* **Boundary:** A dashed black rectangle outlining the maximum resource allocation.
### Detailed Analysis
The path starts with "arm 1" acquiring some amount of "resource 1". Then, the path transitions to a stepped pattern, alternating between acquiring "resource 1" and "resource 2".
The path consists of the following segments:
1. A dark brown horizontal segment representing the initial use of "arm 1" to acquire "resource 1".
2. A light brown horizontal segment moving right, indicating acquisition of "resource 1".
3. A light brown vertical segment moving up, indicating acquisition of "resource 2".
4. A light brown horizontal segment moving right, indicating acquisition of "resource 1".
5. A light brown vertical segment moving up, indicating acquisition of "resource 2".
6. A light brown horizontal segment moving right, indicating acquisition of "resource 1".
7. A light brown vertical segment moving up, indicating acquisition of "resource 2", reaching the upper boundary.
The dashed black rectangle defines the maximum amount of each resource that can be acquired.
### Key Observations
* The diagram illustrates a strategy where resources are acquired incrementally using two "arms".
* The stepped path shows the alternating acquisition of "resource 1" and "resource 2".
* The dashed rectangle represents the resource limit.
### Interpretation
The diagram represents a resource allocation problem where two "arms" are used to acquire two different resources. The stepped path illustrates a specific strategy for acquiring these resources, possibly aiming to balance the acquisition of both resources. The initial use of "arm 1" suggests a starting preference or initial condition. The dashed rectangle indicates a constraint on the total amount of each resource that can be acquired. The diagram could be used to analyze the efficiency or optimality of different resource allocation strategies.