# Technical Document Extraction: Resource Allocation Diagram
## 1. Document Overview
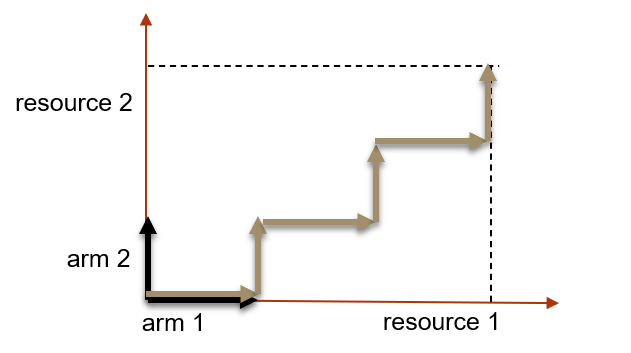
This image is a technical diagram representing a path or trajectory within a 2D coordinate system, likely illustrating a resource allocation strategy or a multi-armed bandit problem. It utilizes a Cartesian-style plot with directional arrows to show a sequence of movements.
## 2. Component Isolation
### A. Coordinate System (Axes)
* **Horizontal Axis (X-axis):** Represented by a solid orange line with an arrowhead pointing right.
* **Label:** "resource 1" (located at the bottom right).
* **Origin Label:** "arm 1" (located at the bottom left, near the intersection).
* **Vertical Axis (Y-axis):** Represented by a solid orange line with an arrowhead pointing upward.
* **Label:** "resource 2" (located at the top left).
* **Origin Label:** "arm 2" (located on the left, slightly above the origin).
### B. Boundary Markers
* **Dashed Lines:** A black dashed line extends horizontally from the top of the Y-axis and vertically from the end of the X-axis, forming a rectangular boundary for the "resource space."
## 3. Data Series and Path Analysis
The diagram features a path composed of several discrete segments (arrows). There are two distinct colors/styles used for the initial movements at the origin, followed by a unified path.
### Initial Vectors (Origin)
1. **Vertical Black Arrow:** A thick black arrow starts at the origin and points upward along the Y-axis toward the "arm 2" label.
2. **Horizontal Black Arrow:** A thick black arrow starts at the origin and points right along the X-axis toward the "arm 1" label.
### Main Trajectory (Tan/Gold Arrows)
The primary data series is a "staircase" or "step" trend moving from the origin toward the top-right boundary. The trend is **monotonically increasing** in both dimensions.
**Step-by-Step Path Description:**
1. **Segment 1 (Horizontal):** Starts at the origin, moves right along the X-axis.
2. **Segment 2 (Vertical):** Moves upward.
3. **Segment 3 (Horizontal):** Moves right.
4. **Segment 4 (Vertical):** Moves upward.
5. **Segment 5 (Horizontal):** Moves right.
6. **Segment 6 (Vertical):** Moves upward, terminating at the intersection of the dashed boundary lines.
## 4. Textual Information Extraction
| Label | Location | Context |
| :--- | :--- | :--- |
| **arm 1** | Bottom Left | X-axis origin/starting point |
| **arm 2** | Middle Left | Y-axis origin/starting point |
| **resource 1** | Bottom Right | X-axis variable/limit |
| **resource 2** | Top Left | Y-axis variable/limit |
## 5. Technical Interpretation
The diagram illustrates a sequential decision-making process where two "arms" (likely representing options or agents) consume two types of "resources."
* The **black arrows** represent the individual directions associated with each arm.
* The **tan staircase path** represents a combined or alternating allocation strategy that eventually reaches the maximum capacity defined by the dashed boundary.
* The path suggests a discrete, incremental progression rather than a continuous linear diagonal, indicating that resources are likely allocated in specific "steps" or "rounds."