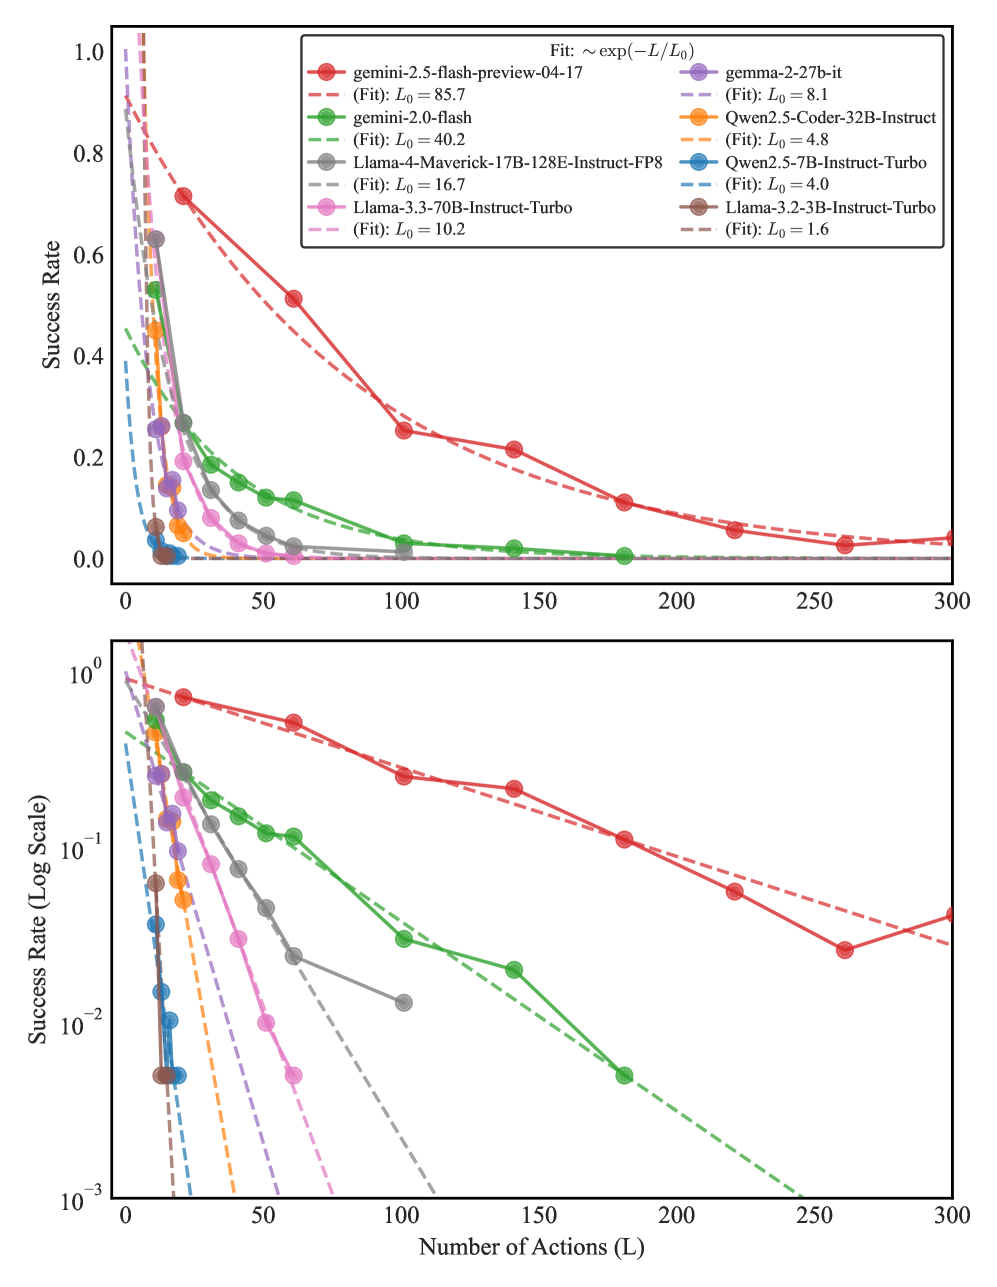
## Success Rate vs. Number of Actions for Various Language Models
### Overview
The image presents two line charts comparing the success rate of different language models against the number of actions performed. The top chart uses a linear scale for the y-axis (Success Rate), while the bottom chart uses a logarithmic scale for the y-axis. Both charts share the same x-axis (Number of Actions). Each model's performance is represented by a colored line, and a dashed line shows the exponential fit.
### Components/Axes
**Top Chart:**
* **Title:** Success Rate vs. Number of Actions (inferred)
* **X-axis:** Number of Actions (L), ranging from 0 to 300. Increments of 50.
* **Y-axis:** Success Rate, ranging from 0.0 to 1.0. Increments of 0.2.
* **Legend:** Located at the top-right of the chart.
* gemini-2.5-flash-preview-04-17 (Red): (Fit) L₀ = 85.7
* gemini-2.0-flash (Green): (Fit) L₀ = 40.2
* Llama-4-Maverick-17B-128E-Instruct-FP8 (Gray): (Fit) L₀ = 16.7
* Llama-3.3-70B-Instruct-Turbo (Pink): (Fit) L₀ = 10.2
* gemma-2-27b-it (Maroon): (Fit) L₀ = 8.1
* Qwen2.5-Coder-32B-Instruct (Orange): (Fit) L₀ = 4.8
* Qwen2.5-7B-Instruct-Turbo (Blue): (Fit) L₀ = 4.0
* Llama-3.2-3B-Instruct-Turbo (Brown): (Fit) L₀ = 1.6
* **Fit Equation:** Fit: ~ exp(-L/L₀)
**Bottom Chart:**
* **Title:** Success Rate (Log Scale) vs. Number of Actions (inferred)
* **X-axis:** Number of Actions (L), ranging from 0 to 300. Increments of 50.
* **Y-axis:** Success Rate (Log Scale), ranging from 10⁻³ to 10⁰ (0.001 to 1).
* **Legend:** Same as the top chart, located at the top-right of the top chart.
### Detailed Analysis
**Top Chart (Linear Scale):**
* **gemini-2.5-flash-preview-04-17 (Red):** Starts at approximately 0.95 and decreases to around 0.1 at 300 actions.
* At 0 actions: ~0.95
* At 50 actions: ~0.72
* At 100 actions: ~0.28
* At 150 actions: ~0.23
* At 200 actions: ~0.18
* At 250 actions: ~0.16
* At 300 actions: ~0.10
* **gemini-2.0-flash (Green):** Starts at approximately 0.95 and decreases to around 0.02 at 300 actions.
* At 0 actions: ~0.95
* At 50 actions: ~0.15
* At 100 actions: ~0.08
* At 150 actions: ~0.05
* At 200 actions: ~0.03
* At 250 actions: ~0.02
* At 300 actions: ~0.02
* **Llama-4-Maverick-17B-128E-Instruct-FP8 (Gray):** Starts at approximately 0.55 and decreases to around 0.01 at 300 actions.
* At 0 actions: ~0.55
* At 50 actions: ~0.08
* At 100 actions: ~0.03
* At 150 actions: ~0.02
* At 200 actions: ~0.01
* At 250 actions: ~0.01
* At 300 actions: ~0.01
* **Llama-3.3-70B-Instruct-Turbo (Pink):** Starts at approximately 0.45 and decreases to around 0.01 at 300 actions.
* At 0 actions: ~0.45
* At 50 actions: ~0.05
* At 100 actions: ~0.02
* At 150 actions: ~0.01
* At 200 actions: ~0.01
* At 250 actions: ~0.01
* At 300 actions: ~0.01
* **gemma-2-27b-it (Maroon):** Starts at approximately 0.35 and decreases to around 0.01 at 300 actions.
* At 0 actions: ~0.35
* At 50 actions: ~0.03
* At 100 actions: ~0.01
* At 150 actions: ~0.01
* At 200 actions: ~0.01
* At 250 actions: ~0.01
* At 300 actions: ~0.01
* **Qwen2.5-Coder-32B-Instruct (Orange):** Starts at approximately 0.20 and decreases to around 0.01 at 300 actions.
* At 0 actions: ~0.20
* At 50 actions: ~0.02
* At 100 actions: ~0.01
* At 150 actions: ~0.01
* At 200 actions: ~0.01
* At 250 actions: ~0.01
* At 300 actions: ~0.01
* **Qwen2.5-7B-Instruct-Turbo (Blue):** Starts at approximately 0.15 and decreases to around 0.01 at 300 actions.
* At 0 actions: ~0.15
* At 50 actions: ~0.01
* At 100 actions: ~0.01
* At 150 actions: ~0.01
* At 200 actions: ~0.01
* At 250 actions: ~0.01
* At 300 actions: ~0.01
* **Llama-3.2-3B-Instruct-Turbo (Brown):** Starts at approximately 0.08 and decreases to around 0.01 at 300 actions.
* At 0 actions: ~0.08
* At 50 actions: ~0.01
* At 100 actions: ~0.01
* At 150 actions: ~0.01
* At 200 actions: ~0.01
* At 250 actions: ~0.01
* At 300 actions: ~0.01
**Bottom Chart (Log Scale):**
The trends are the same as in the top chart, but the logarithmic scale emphasizes the differences in performance at lower success rates. The exponential fits are more clearly visible.
### Key Observations
* The success rate generally decreases as the number of actions increases for all models.
* gemini-2.5-flash-preview-04-17 (Red) has the highest initial success rate and maintains a higher success rate compared to other models as the number of actions increases.
* Llama-3.2-3B-Instruct-Turbo (Brown) has the lowest initial success rate and the success rate drops rapidly.
* The exponential fits provide a good approximation of the performance decay for each model.
### Interpretation
The charts illustrate the performance of various language models in terms of success rate as the number of actions increases. The models exhibit an exponential decay in success rate, indicating that their performance degrades as they perform more actions. The gemini-2.5-flash-preview-04-17 model demonstrates the best performance, maintaining a higher success rate even with a large number of actions. The logarithmic scale in the bottom chart highlights the differences in performance at lower success rates, making it easier to compare the models' long-term performance. The L₀ values in the legend represent the characteristic decay constant for each model, with higher values indicating slower decay and better sustained performance.