TECHNICAL ASSET FINGERPRINT
edb3fd42fd74f78dcd752f85
Click to view fullscreen
Press ESC or click to close
FOUND IN PAPERS
EXPERT: gemini-2.5-flash-free VERSION 1
RUNTIME: google-free/gemini-2.5-flash
INTEL_VERIFIED
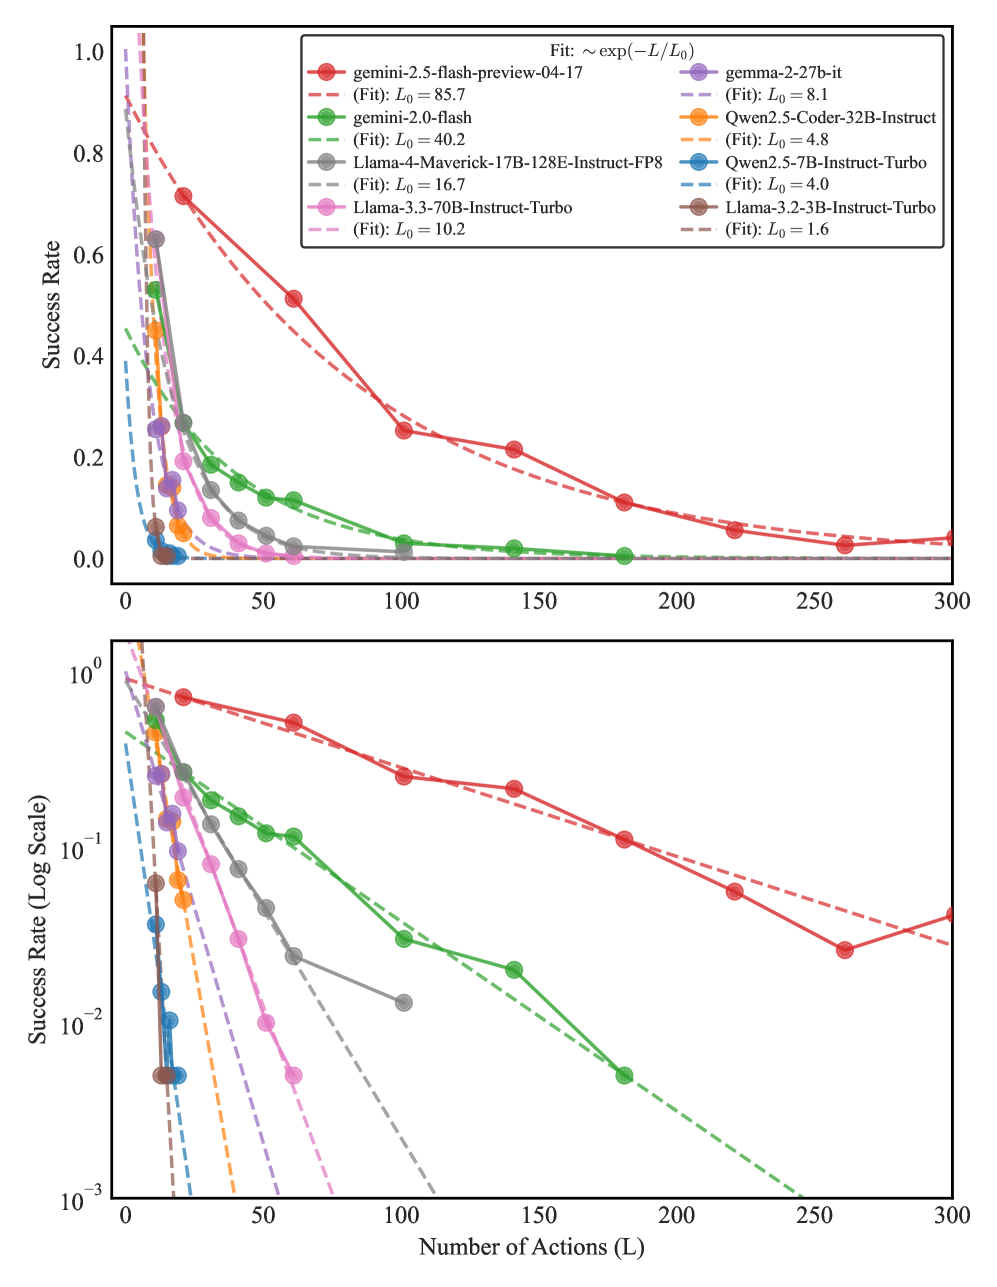
## Chart Type: Two Line Charts (Linear and Logarithmic Success Rate vs. Number of Actions)
### Overview
The image presents two vertically stacked line charts that illustrate the "Success Rate" of eight different language models as a function of "Number of Actions (L)". The top chart uses a linear scale for the Y-axis, while the bottom chart employs a logarithmic scale for the Y-axis, providing different perspectives on the decay of success rate. Both charts share a common X-axis representing the "Number of Actions (L)". Each model's performance is depicted by a series of data points connected by a solid line, alongside a corresponding dashed line representing an exponential fit of the form `~ exp(-L/L₀)`. The characteristic length `L₀` for each model's fit is provided in the legend.
### Components/Axes
**Shared X-axis (Positioned at the bottom of both plots):**
* **Title:** Number of Actions (L)
* **Range:** 0 to 300
* **Major Tick Markers:** 0, 50, 100, 150, 200, 250, 300
**Top Plot Y-axis (Positioned on the left side of the top plot):**
* **Title:** Success Rate
* **Scale:** Linear
* **Range:** 0.0 to 1.0
* **Major Tick Markers:** 0.0, 0.2, 0.4, 0.6, 0.8, 1.0
**Bottom Plot Y-axis (Positioned on the left side of the bottom plot):**
* **Title:** Success Rate (Log Scale)
* **Scale:** Logarithmic (base 10)
* **Range:** 10⁻³ to 10⁰
* **Major Tick Markers:** 10⁻³, 10⁻², 10⁻¹, 10⁰
**Legend (Positioned at the top-right corner of the top plot):**
The legend details eight distinct models and their associated exponential fit parameters. The general form of the fit is `Fit: ~ exp(-L/L₀)`.
1. **gemini-2.5-flash-preview-04-17**
* Data Series: Red solid line with circular markers
* (Fit): L₀ = 85.7
* Fit Line: Red dashed line
2. **gemini-2.0-flash**
* Data Series: Green solid line with circular markers
* (Fit): L₀ = 40.2
* Fit Line: Green dashed line
3. **Llama-4-Maverick-17B-128E-Instruct-FP8**
* Data Series: Gray solid line with circular markers
* (Fit): L₀ = 16.7
* Fit Line: Gray dashed line
4. **Llama-3.3-70B-Instruct-Turbo**
* Data Series: Pink solid line with circular markers
* (Fit): L₀ = 10.2
* Fit Line: Pink dashed line
5. **gemma-2-27b-it**
* Data Series: Purple solid line with circular markers
* (Fit): L₀ = 8.1
* Fit Line: Purple dashed line
6. **Qwen2.5-Coder-32B-Instruct**
* Data Series: Orange solid line with circular markers
* (Fit): L₀ = 4.8
* Fit Line: Orange dashed line
7. **Qwen2.5-7B-Instruct-Turbo**
* Data Series: Light Blue solid line with circular markers
* (Fit): L₀ = 4.0
* Fit Line: Light blue dashed line
8. **Llama-3.2-3B-Instruct-Turbo**
* Data Series: Brown solid line with circular markers
* (Fit): L₀ = 1.6
* Fit Line: Brown dashed line
### Detailed Analysis
All data series consistently demonstrate a decreasing "Success Rate" as the "Number of Actions (L)" increases, which is characteristic of an exponential decay. The dashed lines represent the exponential fits, where a larger L₀ value indicates a slower decay and thus a more robust performance over a greater number of actions.
**Top Plot (Linear Y-axis):**
* **gemini-2.5-flash-preview-04-17 (Red, L₀ = 85.7):** Shows the slowest decay. Starts near 1.0 at L=0, decreases to approximately 0.52 at L=50, 0.25 at L=100, 0.1 at L=200, and around 0.05 at L=300.
* **gemini-2.0-flash (Green, L₀ = 40.2):** Decays faster than the red series. Starts near 1.0 at L=0, drops to about 0.2 at L=50, 0.1 at L=100, and approximately 0.01 at L=200.
* **Llama-4-Maverick-17B-128E-Instruct-FP8 (Gray, L₀ = 16.7):** Decays significantly faster. Starts near 1.0 at L=0, falls to about 0.2 at L=20, 0.05 at L=50, and approximately 0.01 at L=100.
* **Llama-3.3-70B-Instruct-Turbo (Pink, L₀ = 10.2):** Exhibits rapid decay. Starts near 1.0 at L=0, drops to about 0.3 at L=10, 0.1 at L=20, and approximately 0.01 at L=50.
* **gemma-2-27b-it (Purple, L₀ = 8.1):** Decays very rapidly, slightly faster than pink. Starts near 1.0 at L=0, drops to about 0.25 at L=10, 0.08 at L=20, and approximately 0.01 at L=40.
* **Qwen2.5-Coder-32B-Instruct (Orange, L₀ = 4.8):** Shows extremely rapid decay. Starts near 1.0 at L=0, drops to about 0.1 at L=10, and approximately 0.02 at L=20.
* **Qwen2.5-7B-Instruct-Turbo (Light Blue, L₀ = 4.0):** Decays extremely rapidly, slightly faster than orange. Starts near 1.0 at L=0, drops to about 0.08 at L=10, and approximately 0.01 at L=20.
* **Llama-3.2-3B-Instruct-Turbo (Brown, L₀ = 1.6):** Displays the most rapid decay. Starts near 1.0 at L=0, drops to about 0.05 at L=5, and approximately 0.005 at L=10.
**Bottom Plot (Logarithmic Y-axis):**
This plot effectively visualizes the exponential decay as linear slopes. The closer the solid data line is to its dashed fit line, the better the exponential model describes the data.
* **gemini-2.5-flash-preview-04-17 (Red, L₀ = 85.7):** Appears as the flattest, most gradually declining line, closely following its fit. Success Rate is approximately 0.5 at L=50, 0.1 at L=200, and 0.04 at L=300.
* **gemini-2.0-flash (Green, L₀ = 40.2):** Shows a steeper decline than the red series, with data points closely matching the fit. Success Rate is approximately 0.2 at L=50, 0.08 at L=100, and 0.01 at L=200.
* **Llama-4-Maverick-17B-128E-Instruct-FP8 (Gray, L₀ = 16.7):** Exhibits a significantly steeper slope. Success Rate is approximately 0.2 at L=20, 0.04 at L=50, and 0.002 at L=100.
* **Llama-3.3-70B-Instruct-Turbo (Pink, L₀ = 10.2):** Shows a very steep decline. Success Rate is approximately 0.3 at L=10, 0.1 at L=20, and 0.005 at L=50.
* **gemma-2-27b-it (Purple, L₀ = 8.1):** Displays a very steep decline, slightly steeper than pink. Success Rate is approximately 0.25 at L=10, 0.08 at L=20, and 0.01 at L=40.
* **Qwen2.5-Coder-32B-Instruct (Orange, L₀ = 4.8):** Exhibits an extremely steep decline. Success Rate is approximately 0.1 at L=10, 0.02 at L=20, and 0.005 at L=30.
* **Qwen2.5-7B-Instruct-Turbo (Light Blue, L₀ = 4.0):** Shows an extremely steep decline, slightly steeper than orange. Success Rate is approximately 0.08 at L=10, 0.01 at L=20, and 0.002 at L=30.
* **Llama-3.2-3B-Instruct-Turbo (Brown, L₀ = 1.6):** Displays the steepest decline among all models. Success Rate is approximately 0.05 at L=5 and 0.005 at L=10.
### Key Observations
* **Exponential Decay:** All models demonstrate an exponential decay in success rate as the number of actions increases, with the `exp(-L/L₀)` function providing a good fit for the observed data.
* **L₀ as a Robustness Indicator:** The characteristic length L₀ is a direct measure of a model's ability to maintain its success rate over a longer sequence of actions. A higher L₀ indicates greater robustness and slower performance degradation.
* **Clear Performance Hierarchy:**
* `gemini-2.5-flash-preview-04-17` (L₀ = 85.7) is significantly more robust than all other models, maintaining a high success rate even at 300 actions.
* `gemini-2.0-flash` (L₀ = 40.2) is the second-best performer, showing substantial resilience compared to the Llama and Qwen series.
* `Llama-4-Maverick-17B-128E-Instruct-FP8`
DECODING INTELLIGENCE...