\n
## Chart: Success Rate vs. Number of Actions
### Overview
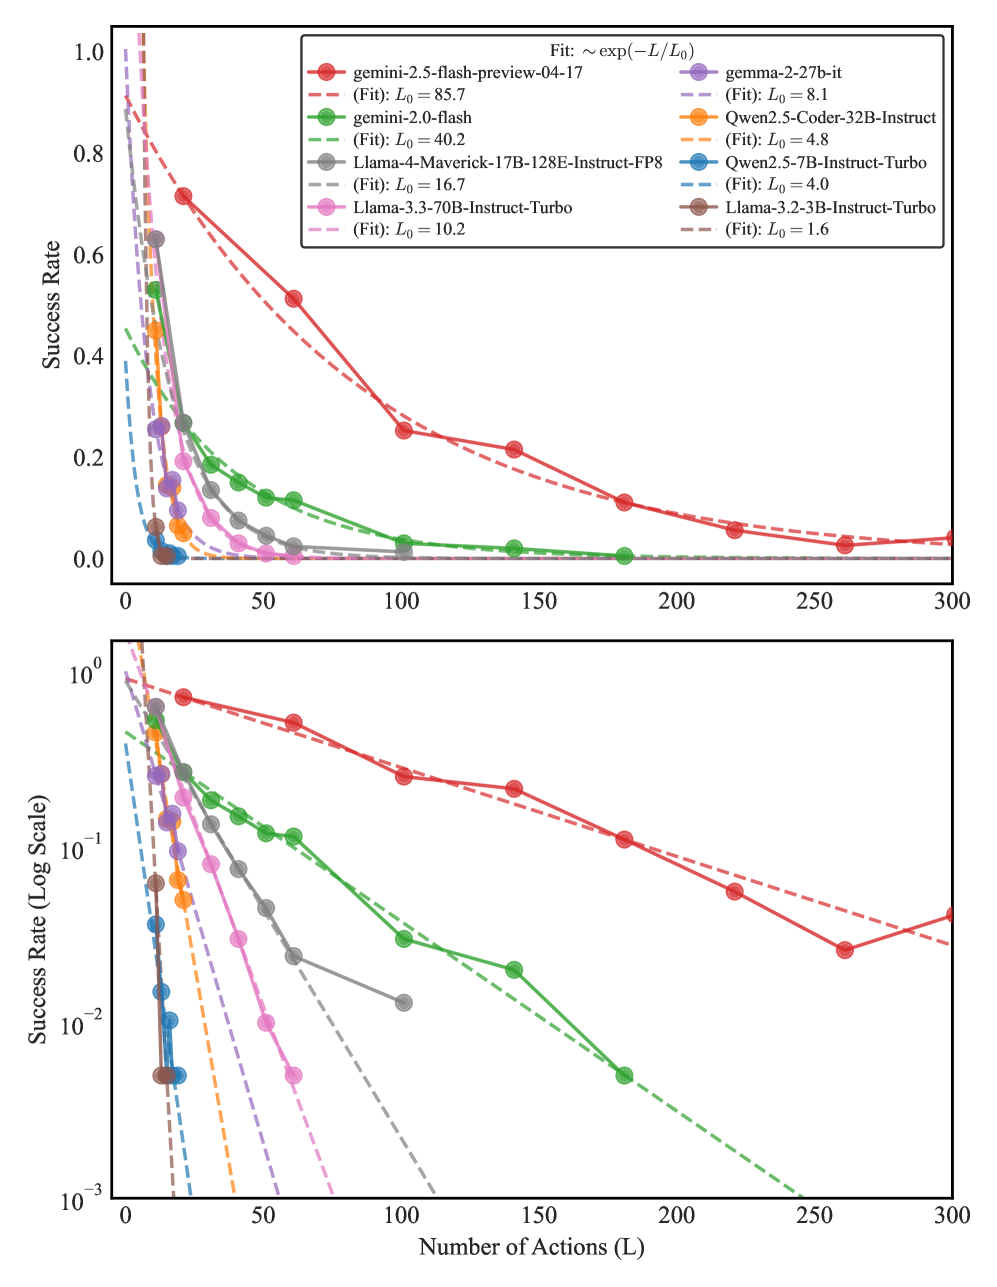
The image presents two charts displaying the relationship between the number of actions (L) and the success rate for several language models. The top chart uses a linear scale for the success rate, while the bottom chart uses a logarithmic scale. Both charts depict the decay of success rate as the number of actions increases. A fitted exponential decay function is indicated for each model.
### Components/Axes
* **X-axis (both charts):** Number of Actions (L), ranging from 0 to 300.
* **Y-axis (top chart):** Success Rate, ranging from 0.0 to 1.0.
* **Y-axis (bottom chart):** Success Rate (Log Scale), ranging from 10<sup>-3</sup> to 10<sup>0</sup>.
* **Legend (top-right):** Lists the language models and their corresponding colors:
* gemini-2.5-flash-preview-04-17 (green) - (Fit): L<sub>0</sub> = 85.7
* gemini-2.0-flash (dark green) - (Fit): L<sub>0</sub> = 40.2
* Llama-2-70B-Instruct-FP8 (light green) - (Fit): L<sub>0</sub> = 16.7
* Llama-3.3-70B-Instruct-Turbo (olive green) - (Fit): L<sub>0</sub> = 10.2
* gamma-2-27b-it (purple) - (Fit): L<sub>0</sub> = 8.1
* Owen2.5-Coder-32B-Instruct (orange) - (Fit): L<sub>0</sub> = 4.8
* Owen2.5-7B-Instruct-Turbo (red) - (Fit): L<sub>0</sub> = 4.0
* Llama-3.2-3B-Instruct-Turbo (brown) - (Fit): L<sub>0</sub> = 1.6
* **Title (top):** Fit: ~ exp(-L/L<sub>0</sub>)
### Detailed Analysis
**Top Chart (Linear Scale):**
* **gemini-2.5-flash-preview-04-17 (green):** Starts at approximately 0.95 success rate at L=0, and decays relatively slowly, reaching approximately 0.15 at L=300.
* **gemini-2.0-flash (dark green):** Starts at approximately 0.85 success rate at L=0, and decays more rapidly than the previous model, reaching approximately 0.05 at L=300.
* **Llama-2-70B-Instruct-FP8 (light green):** Starts at approximately 0.75 success rate at L=0, and decays rapidly, reaching approximately 0.02 at L=300.
* **Llama-3.3-70B-Instruct-Turbo (olive green):** Starts at approximately 0.65 success rate at L=0, and decays moderately, reaching approximately 0.03 at L=300.
* **gamma-2-27b-it (purple):** Starts at approximately 0.80 success rate at L=0, and decays rapidly, reaching approximately 0.01 at L=300.
* **Owen2.5-Coder-32B-Instruct (orange):** Starts at approximately 0.70 success rate at L=0, and decays moderately, reaching approximately 0.02 at L=300.
* **Owen2.5-7B-Instruct-Turbo (red):** Starts at approximately 0.60 success rate at L=0, and decays rapidly, reaching approximately 0.01 at L=300.
* **Llama-3.2-3B-Instruct-Turbo (brown):** Starts at approximately 0.50 success rate at L=0, and decays rapidly, reaching approximately 0.005 at L=300.
**Bottom Chart (Log Scale):**
* The trends are the same as the top chart, but the logarithmic scale emphasizes the initial rapid decay of success rate for all models. The curves appear more linear on this scale, supporting the exponential decay fit.
* The initial slopes of the curves on the log scale visually represent the rate of decay. Steeper slopes indicate faster decay.
### Key Observations
* All models exhibit a decreasing success rate as the number of actions increases.
* The models differ significantly in their initial success rates and the rate at which their success rates decay.
* `gemini-2.5-flash-preview-04-17` maintains the highest success rate across a wider range of actions.
* `Llama-3.2-3B-Instruct-Turbo` has the lowest initial success rate and the fastest decay.
* The fitted L<sub>0</sub> values (representing the characteristic scale of decay) vary considerably between models, indicating different sensitivities to the number of actions.
### Interpretation
The charts demonstrate the trade-off between the number of actions taken by a language model and the probability of achieving a successful outcome. The exponential decay fit suggests that the success rate decreases predictably with each additional action. The varying L<sub>0</sub> values indicate that some models are more robust to increasing action counts than others.
The differences in performance between models likely reflect variations in their underlying architectures, training data, and optimization strategies. Models with higher initial success rates and larger L<sub>0</sub> values are better suited for tasks requiring a large number of actions, while models with lower initial success rates and smaller L<sub>0</sub> values may be more appropriate for simpler tasks.
The use of both linear and logarithmic scales provides a comprehensive view of the data. The linear scale highlights the absolute success rates, while the logarithmic scale emphasizes the relative rates of decay. The consistency of the trends across both scales strengthens the validity of the observed patterns. The data suggests that the complexity of the task, as measured by the number of actions required, significantly impacts the success rate of these language models.