## Line Graph: Model Success Rate Decay vs. Number of Actions
### Overview
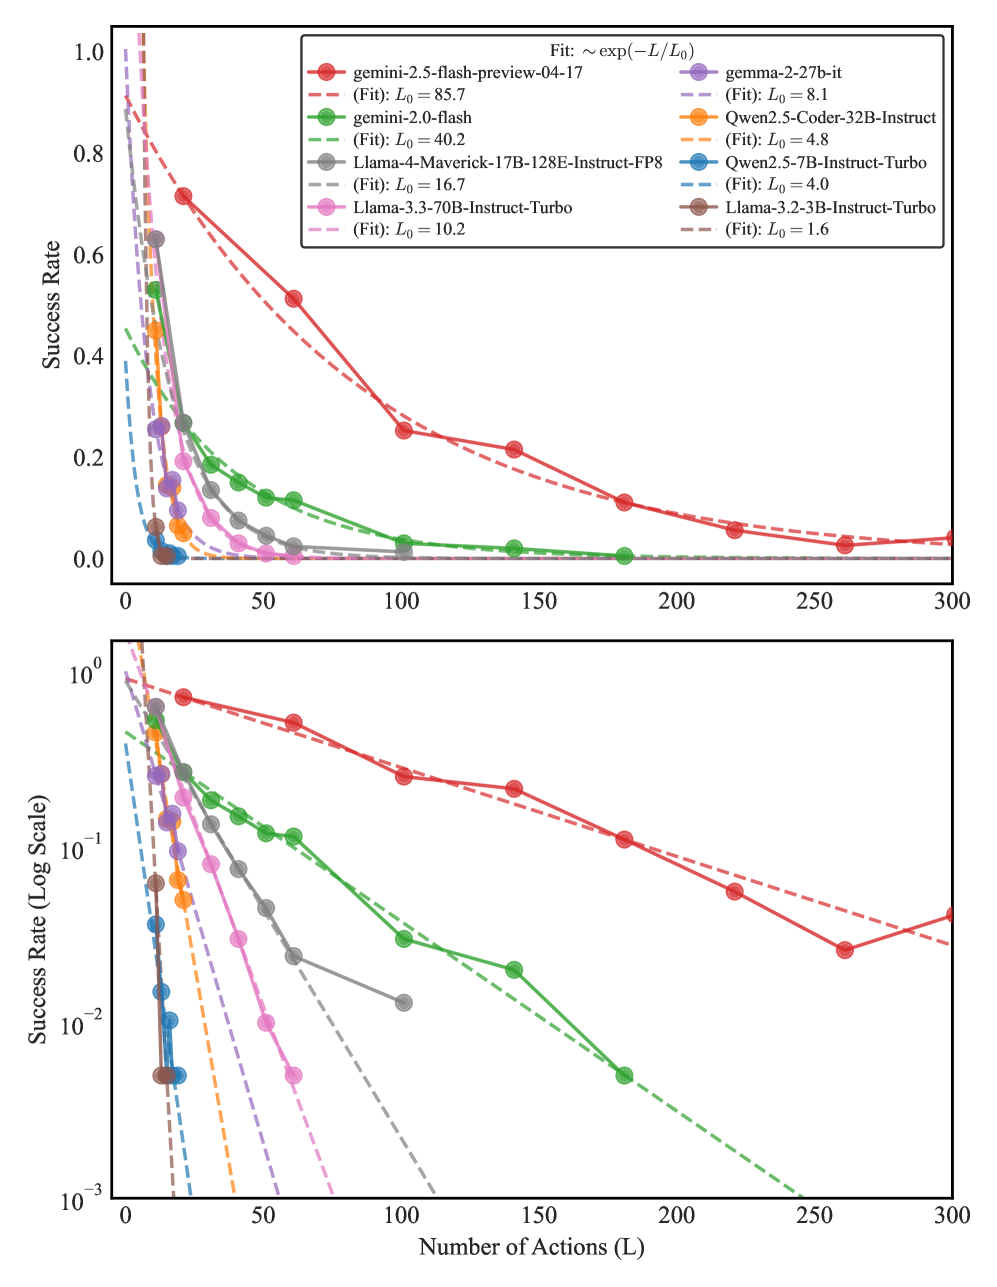
The image contains two vertically stacked line graphs comparing the success rate decay of various AI models as a function of the number of actions (L). The top plot uses a linear scale (0-1) for success rate, while the bottom plot uses a logarithmic scale (10⁻³-1). Both plots show exponential decay patterns with fitted curves of the form ~exp(-L/L₀).
### Components/Axes
- **X-axis**: Number of Actions (L) ranging from 0 to 300
- **Y-axis (Top)**: Success Rate (0-1)
- **Y-axis (Bottom)**: Success Rate (Log Scale, 10⁻³-1)
- **Legend**: Located in top-right corner, containing:
- Model names (solid lines)
- Fitted exponential curves (dashed lines)
- Corresponding L₀ values (time constants)
### Detailed Analysis
1. **Gemini 2.5-flash-preview-04-17** (Red):
- Solid line: Starts at ~0.95 success rate
- Dashed fit: L₀ = 85.7 (slowest decay)
- Success rate drops below 0.1 after ~200 actions
2. **Gemini 2.0-flash** (Green):
- Solid line: Starts at ~0.75
- Dashed fit: L₀ = 40.2
- Success rate below 0.1 after ~150 actions
3. **Llama-4-Maverick-17B-128E-Instruct-FP8** (Gray):
- Solid line: Starts at ~0.65
- Dashed fit: L₀ = 16.7
- Success rate below 0.1 after ~100 actions
4. **Llama-3.3-70B-Instruct-Turbo** (Pink):
- Solid line: Starts at ~0.55
- Dashed fit: L₀ = 10.2
- Success rate below 0.1 after ~80 actions
5. **Qwen2.5-Coder-32B-Instruct** (Orange):
- Solid line: Starts at ~0.45
- Dashed fit: L₀ = 4.8
- Success rate below 0.1 after ~60 actions
6. **Qwen2.5-7B-Instruct-Turbo** (Blue):
- Solid line: Starts at ~0.35
- Dashed fit: L₀ = 4.0
- Success rate below 0.1 after ~50 actions
7. **Llama-3.2-3B-Instruct-Turbo** (Brown):
- Solid line: Starts at ~0.25
- Dashed fit: L₀ = 1.6 (fastest decay)
- Success rate below 0.1 after ~40 actions
### Key Observations
1. All models show exponential decay patterns with success rates approaching zero as L increases
2. Larger models (Gemini 2.5, Llama-3.3) maintain higher success rates longer
3. L₀ values correlate with model size/performance:
- L₀ > 50: Large models (Gemini 2.5)
- 10 < L₀ < 50: Mid-sized models (Llama-4, Llama-3.3)
- L₀ < 10: Smaller models (Qwen, Llama-3.2)
4. Log-scale plot reveals linear decay patterns, confirming exponential nature
5. All models start near 100% success rate at L=0
### Interpretation
The data demonstrates that model architecture and parameter scale significantly impact performance degradation over sequential actions. The L₀ parameter acts as a "decay constant" where:
- Higher L₀ values indicate better robustness to extended action sequences
- Exponential decay suggests diminishing returns in model performance with increased complexity
- The log-scale visualization helps identify decay rates that would be difficult to discern on linear plots
- Model size appears to be the primary factor determining decay rate, with larger models maintaining performance longer
This analysis suggests that for tasks requiring sustained performance over many actions, larger models like Gemini 2.5-flash-preview-04-17 would be preferable despite their higher computational costs.