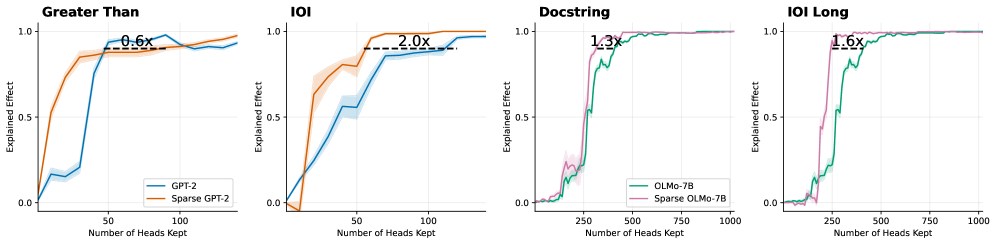
## Chart Type: Multiple Line Graphs
### Overview
The image presents four line graphs comparing the "Explained Effect" of different models (GPT-2, Sparse GPT-2, OLMo-7B, Sparse OLMo-7B) against the "Number of Heads Kept." Each graph represents a different task: "Greater Than," "IOI," "Docstring," and "IOI Long." The graphs show how the explained effect changes as the number of heads kept increases. Each graph also includes a horizontal dashed line indicating a specific performance level, with a label indicating a multiplicative factor (e.g., "0.6x", "2.0x").
### Components/Axes
* **X-axis (Horizontal):** "Number of Heads Kept." The scales vary across the graphs.
* "Greater Than" and "IOI": 0 to 100, with tick marks at 50 and 100.
* "Docstring" and "IOI Long": 0 to 1000, with tick marks at 250, 500, 750, and 1000.
* **Y-axis (Vertical):** "Explained Effect." The scale is consistent across all graphs, ranging from 0.0 to 1.0, with a tick mark at 0.5.
* **Legends (Bottom of the first and third graphs):**
* "Greater Than" and "IOI":
* Blue line: "GPT-2"
* Orange line: "Sparse GPT-2"
* "Docstring" and "IOI Long":
* Green line: "OLMo-7B"
* Pink line: "Sparse OLMo-7B"
* **Titles (Top of each graph):** "Greater Than," "IOI," "Docstring," "IOI Long."
* **Horizontal Dashed Lines:** Each graph has a horizontal dashed line indicating a specific performance level.
* "Greater Than": Dashed line at approximately y=0.9, labeled "0.6x" above the line.
* "IOI": Dashed line at approximately y=0.85, labeled "2.0x" above the line.
* "Docstring": Dashed line at approximately y=0.9, labeled "1.3x" above the line.
* "IOI Long": Dashed line at approximately y=0.9, labeled "1.6x" above the line.
### Detailed Analysis
**1. Greater Than**
* **GPT-2 (Blue):** The line starts at approximately 0.0 and increases rapidly to approximately 0.9 around x=50. It then plateaus and fluctuates slightly between 0.9 and 1.0.
* **Sparse GPT-2 (Orange):** The line starts at approximately 0.0 and increases more gradually than GPT-2, reaching approximately 0.9 around x=75. It then plateaus and fluctuates slightly between 0.9 and 1.0.
* **Dashed Line:** The dashed line is at approximately y=0.9, labeled "0.6x".
**2. IOI**
* **GPT-2 (Blue):** The line starts at approximately 0.0 and increases rapidly to approximately 0.8 around x=75. It then plateaus and fluctuates slightly between 0.8 and 0.9.
* **Sparse GPT-2 (Orange):** The line starts at approximately 0.0 and increases more gradually than GPT-2, reaching approximately 0.8 around x=50. It then increases to approximately 1.0.
* **Dashed Line:** The dashed line is at approximately y=0.85, labeled "2.0x".
**3. Docstring**
* **OLMo-7B (Green):** The line starts at approximately 0.0 and increases rapidly to approximately 0.9 around x=250. It then plateaus and fluctuates slightly between 0.9 and 1.0.
* **Sparse OLMo-7B (Pink):** The line starts at approximately 0.0 and increases rapidly to approximately 0.9 around x=250. It then plateaus and fluctuates slightly between 0.9 and 1.0.
* **Dashed Line:** The dashed line is at approximately y=0.9, labeled "1.3x".
**4. IOI Long**
* **OLMo-7B (Green):** The line starts at approximately 0.0 and increases rapidly to approximately 0.9 around x=250. It then plateaus and fluctuates slightly between 0.9 and 1.0.
* **Sparse OLMo-7B (Pink):** The line starts at approximately 0.0 and increases rapidly to approximately 0.9 around x=250. It then plateaus and fluctuates slightly between 0.9 and 1.0.
* **Dashed Line:** The dashed line is at approximately y=0.9, labeled "1.6x".
### Key Observations
* In the "Greater Than" task, GPT-2 reaches a high explained effect faster than Sparse GPT-2.
* In the "IOI" task, Sparse GPT-2 reaches a higher explained effect than GPT-2.
* In the "Docstring" and "IOI Long" tasks, OLMo-7B and Sparse OLMo-7B perform similarly.
* The "Number of Heads Kept" required to reach a high explained effect varies significantly between the tasks. "Greater Than" and "IOI" require fewer heads than "Docstring" and "IOI Long."
* The dashed lines indicate a performance threshold, and the labels (e.g., "0.6x", "2.0x") likely represent a factor related to the performance at that threshold.
### Interpretation
The graphs illustrate the trade-off between model sparsity and performance on different tasks. Sparsity, achieved by reducing the number of heads kept, can impact the explained effect. The results suggest that the optimal level of sparsity depends on the specific task. For example, Sparse GPT-2 outperforms GPT-2 on the "IOI" task, indicating that sparsity can sometimes improve performance. The "Docstring" and "IOI Long" tasks show that OLMo-7B and Sparse OLMo-7B perform similarly, suggesting that sparsity does not significantly impact performance on these tasks. The multiplicative factors associated with the dashed lines likely represent a comparison of performance relative to a baseline or another model, but without further context, their precise meaning is unclear. The data suggests that model architecture and sparsity should be carefully considered and tuned based on the specific task requirements.