TECHNICAL ASSET FINGERPRINT
edbe2c685f2f5c1280a4e91c
Click to view fullscreen
Press ESC or click to close
FOUND IN PAPERS
EXPERT: gemini-3.1-pro-preview VERSION 1
RUNTIME: gemini/gemini-3.1-pro-preview
INTEL_VERIFIED
## Line Charts: Explained Effect vs. Number of Heads Kept for Dense and Sparse Models
### Overview
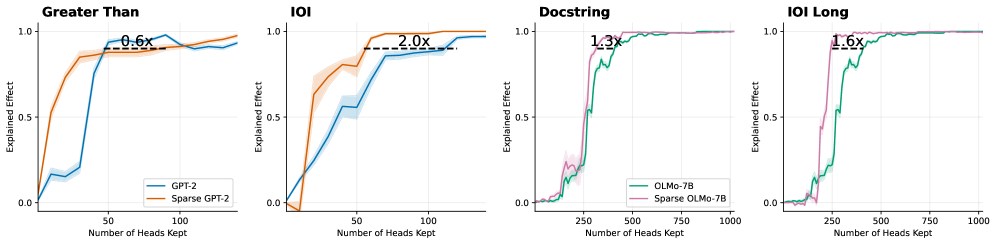
This image consists of four side-by-side line charts comparing the "Explained Effect" against the "Number of Heads Kept" for standard (dense) language models versus their sparse counterparts across four different tasks. The image is divided into four distinct panels from left to right. The first two panels compare GPT-2 models, while the last two compare OLMo-7B models. All text in the image is in English.
### Components/Axes
**Global Elements (Consistent across all panels):**
* **Y-axis Label:** "Explained Effect" (positioned vertically on the left of each panel).
* **Y-axis Scale:** Marked at 0.0, 0.5, and 1.0. Faint horizontal grid lines correspond to these values.
* **X-axis Label:** "Number of Heads Kept" (positioned horizontally at the bottom of each panel).
* **Data Representation:** Solid lines represent the mean value, surrounded by lighter shaded regions representing variance or confidence intervals.
* **Annotations:** Each panel features a horizontal dashed black line connecting the two model curves at a high Y-value (typically between 0.85 and 0.95), accompanied by a text label indicating a multiplier (e.g., "0.6x").
**Panel-Specific Elements:**
* **Panel 1 (Far Left):**
* **Title:** "Greater Than" (Top left).
* **X-axis Markers:** 50, 100.
* **Legend:** Located in the bottom right.
* Blue line = "GPT-2"
* Orange line = "Sparse GPT-2"
* **Panel 2 (Center Left):**
* **Title:** "IOI" (Top left).
* **X-axis Markers:** 50, 100.
* **Legend:** None explicitly present. Colors visually inherit from Panel 1 (Blue = GPT-2, Orange = Sparse GPT-2).
* **Panel 3 (Center Right):**
* **Title:** "Docstring" (Top left).
* **X-axis Markers:** 250, 500, 750, 1000.
* **Legend:** Located in the bottom right.
* Teal/Green line = "OLMo-7B"
* Purple/Pink line = "Sparse OLMo-7B"
* **Panel 4 (Far Right):**
* **Title:** "IOI Long" (Top left).
* **X-axis Markers:** 250, 500, 750, 1000.
* **Legend:** None explicitly present. Colors visually inherit from Panel 3 (Teal = OLMo-7B, Purple = Sparse OLMo-7B).
---
### Detailed Analysis
#### Panel 1: Greater Than
* **Visual Trend:** The Sparse GPT-2 (orange) curve rises much earlier and steeper than the standard GPT-2 (blue) curve. The blue curve remains low until a sudden spike.
* **Data Points (Approximate):**
* *Sparse GPT-2 (Orange):* Starts at (0, 0). Rises sharply to y≈0.5 at x≈10. Reaches y≈0.8 at x≈25. Plateaus around y≈0.9 from x≈40 onward.
* *GPT-2 (Blue):* Starts at (0, 0). Rises slowly to y≈0.2 at x≈40. Spikes sharply to y≈0.9 at x≈50. Fluctuates slightly between 0.85 and 0.95 thereafter.
* **Annotation:** A dashed line at y≈0.85 spans from the orange curve (x≈25) to the blue curve (x≈45). The text above it reads **"0.6x"**.
#### Panel 2: IOI
* **Visual Trend:** The Sparse GPT-2 (orange) curve again rises earlier and steeper than the standard GPT-2 (blue) curve, which exhibits a more gradual, steady climb.
* **Data Points (Approximate):**
* *Sparse GPT-2 (Orange):* Starts at (0, 0), dips slightly below 0, then shoots up at x≈20 to y≈0.6. Reaches y≈0.95 at x≈60 and plateaus near 1.0.
* *GPT-2 (Blue):* Starts at (0, 0). Rises steadily, reaching y≈0.5 at x≈40, y≈0.8 at x≈70, and slowly climbs to y≈0.95 at x≈140.
* **Annotation:** A dashed line at y≈0.9 spans from the orange curve (x≈55) to the blue curve (x≈110). The text above it reads **"2.0x"**.
#### Panel 3: Docstring
* **Visual Trend:** Both models stay near zero initially. The Sparse OLMo-7B (purple) curve spikes to a high explained effect earlier than the standard OLMo-7B (teal) curve.
* **Data Points (Approximate):**
* *Sparse OLMo-7B (Purple):* Starts near 0. Small bump at x≈200 (y≈0.2). Shoots up sharply at x≈250 to y≈0.9. Plateaus near 1.0 from x≈400 onward.
* *OLMo-7B (Teal):* Starts near 0. Small bump at x≈200 (y≈0.15). Shoots up sharply at x≈300 to y≈0.8, climbing to y≈0.95 at x≈500. Plateaus near 1.0.
* **Annotation:** A dashed line at y≈0.9 spans from the purple curve (x≈300) to the teal curve (x≈400). The text above it reads **"1.3x"**.
#### Panel 4: IOI Long
* **Visual Trend:** The Sparse OLMo-7B (purple) curve rises in a single sharp spike, while the standard OLMo-7B (teal) curve rises in a more stepped, gradual manner later on the x-axis.
* **Data Points (Approximate):**
* *Sparse OLMo-7B (Purple):* Starts near 0. Shoots up sharply at x≈200 to y≈0.95. Plateaus near 1.0.
* *OLMo-7B (Teal):* Starts near 0. Rises in steps: y≈0.15 at x≈200, y≈0.5 at x≈250, y≈0.8 at x≈300, reaching y≈0.95 at x≈450. Plateaus near 1.0.
* **Annotation:** A dashed line at y≈0.9 spans from the purple curve (x≈250) to the teal curve (x≈400). The text above it reads **"1.6x"**.
---
### Key Observations
1. **Consistent Leftward Shift:** Across all four tasks and both model architectures (GPT-2 and OLMo-7B), the curve for the "Sparse" model is consistently shifted to the left compared to the standard model.
2. **Efficiency Multipliers:** The dashed lines and multipliers quantify the horizontal gap between the curves at a high performance threshold (y ≈ 0.85 to 0.95).
* In Panels 2, 3, and 4, the multipliers (2.0x, 1.3x, 1.6x) appear to represent the ratio of heads required by the Dense model compared to the Sparse model (Dense / Sparse). For example, in Panel 2, 110 / 55 = 2.0.
* In Panel 1, the multiplier "0.6x" appears to represent the inverse ratio (Sparse / Dense), as the sparse model requires roughly 25 heads to reach the threshold, while the dense requires roughly 45 (25 / 45 ≈ 0.55, rounded to 0.6x).
3. **Scale Differences:** The GPT-2 tasks (Panels 1 & 2) achieve maximum explained effect with fewer than 150 heads. The OLMo-7B tasks (Panels 3 & 4) require significantly more heads, scaling up to 1000, indicating a larger model or more distributed task representation.
### Interpretation
This data strongly demonstrates that **sparse models are significantly more efficient at concentrating task-specific mechanisms into fewer attention heads** compared to standard, dense models.
In the context of mechanistic interpretability, "Explained Effect" likely measures how well a specific subset of attention heads can account for the model's overall performance on a specific task (like "Greater Than" or "Indirect Object Identification - IOI"). Because the sparse curves reach a high Explained Effect (e.g., 0.9 or 90%) much earlier on the X-axis, it proves that pruning or sparse training forces the model to localize its reasoning circuits.
The multipliers explicitly quantify this efficiency gain. For instance, in the "IOI" task (Panel 2), standard GPT-2 requires twice as many heads (2.0x) to achieve the same explanatory power as Sparse GPT-2. This suggests that sparsity reduces the redundancy and distribution of features across heads, making the resulting models much easier to reverse-engineer and interpret, as the critical behaviors are isolated within a much smaller, more manageable subset of components.
DECODING INTELLIGENCE...