TECHNICAL ASSET FINGERPRINT
edbe2c685f2f5c1280a4e91c
Click to view fullscreen
Press ESC or click to close
FOUND IN PAPERS
EXPERT: healer-alpha-free VERSION 1
RUNTIME: free/openrouter/healer-alpha
INTEL_VERIFIED
## Line Charts: Model Performance Comparison (Explained Effect vs. Number of Heads Kept)
### Overview
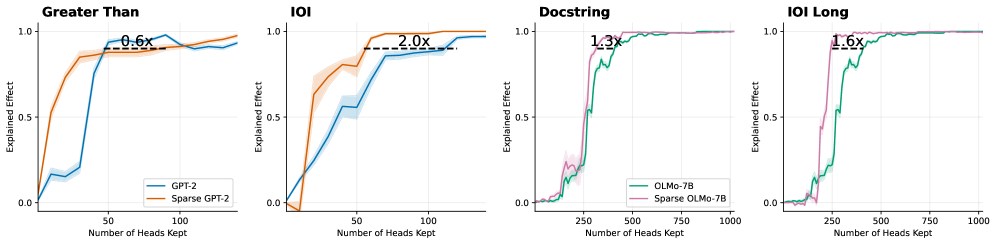
The image displays four separate line charts arranged horizontally, comparing the performance of standard and sparse versions of two language models (GPT-2 and OLMo-7B) across four different evaluation tasks. Each chart plots the "Explained Effect" (y-axis) against the "Number of Heads Kept" (x-axis), showing how model performance changes as more attention heads are retained. The charts include annotations indicating the performance multiplier (e.g., "2.0x") of the sparse model relative to the standard model at a specific point.
### Components/Axes
* **Common Y-Axis (All Charts):** Label: "Explained Effect". Scale: Linear, ranging from 0.0 to 1.0, with major ticks at 0.0, 0.5, and 1.0.
* **X-Axis (Varies by Chart):** Label: "Number of Heads Kept". Scale: Linear. The range differs:
* "Greater Than" & "IOI": 0 to ~120 (ticks at 0, 50, 100).
* "Docstring" & "IOI Long": 0 to 1000 (ticks at 0, 250, 500, 750, 1000).
* **Legends:**
* **Left Two Charts ("Greater Than", "IOI"):** Located in the bottom-right corner of each plot area.
* Blue Line: "GPT-2"
* Orange Line: "Sparse GPT-2"
* **Right Two Charts ("Docstring", "IOI Long"):** Located in the bottom-right corner of each plot area.
* Green Line: "OLMo-7B"
* Pink Line: "Sparse OLMo-7B"
* **Annotations:** Each chart contains a horizontal dashed black line with a text label indicating a multiplier (e.g., "0.6x"). This line connects points on the two curves to highlight the relative performance difference.
### Detailed Analysis
**1. Chart: "Greater Than"**
* **Trend Verification:** Both lines show a steep, sigmoidal increase from near 0.0, plateauing near 1.0. The orange line (Sparse GPT-2) rises more sharply initially.
* **Data Points & Annotation:**
* The dashed line is positioned at approximately y=0.85.
* It connects the blue line (GPT-2) at x ≈ 50 to the orange line (Sparse GPT-2) at x ≈ 30.
* Annotation: "0.6x". This indicates that the Sparse GPT-2 model achieves the same explained effect (~0.85) using only about 60% (0.6x) of the heads required by the standard GPT-2 model at that performance level.
* Both models converge to an Explained Effect of ~0.95-1.0 by x=100.
**2. Chart: "IOI"**
* **Trend Verification:** Both lines increase from near 0.0. The orange line (Sparse GPT-2) maintains a significant lead over the blue line (GPT-2) throughout the ascent before both plateau.
* **Data Points & Annotation:**
* The dashed line is positioned at approximately y=0.9.
* It connects the blue line (GPT-2) at x ≈ 100 to the orange line (Sparse GPT-2) at x ≈ 50.
* Annotation: "2.0x". This indicates that the Sparse GPT-2 model achieves the same explained effect (~0.9) using only about 50% (1/2.0x) of the heads required by the standard GPT-2 model.
* Sparse GPT-2 reaches near-maximum performance (~1.0) by x=75, while GPT-2 reaches it by x=120.
**3. Chart: "Docstring"**
* **Trend Verification:** Both lines show a very sharp, almost step-like increase from near 0.0 to 1.0. The pink line (Sparse OLMo-7B) is slightly to the left (more efficient) of the green line (OLMo-7B).
* **Data Points & Annotation:**
* The dashed line is positioned at approximately y=0.95.
* It connects the green line (OLMo-7B) at x ≈ 350 to the pink line (Sparse OLMo-7B) at x ≈ 270.
* Annotation: "1.3x". This indicates that the Sparse OLMo-7B model achieves the same high explained effect (~0.95) using about 77% (1/1.3x) of the heads required by the standard OLMo-7B model.
* Both models reach a plateau of 1.0 by x=500.
**4. Chart: "IOI Long"**
* **Trend Verification:** Similar to "Docstring", both lines exhibit a sharp, step-like increase. The pink line (Sparse OLMo-7B) again leads the green line (OLMo-7B).
* **Data Points & Annotation:**
* The dashed line is positioned at approximately y=0.9.
* It connects the green line (OLMo-7B) at x ≈ 400 to the pink line (Sparse OLMo-7B) at x ≈ 250.
* Annotation: "1.6x". This indicates that the Sparse OLMo-7B model achieves the same explained effect (~0.9) using about 63% (1/1.6x) of the heads required by the standard OLMo-7B model.
* Both models converge to 1.0 by x=750.
### Key Observations
1. **Consistent Superiority of Sparse Models:** In all four tasks, the sparse model variant (orange or pink line) achieves any given level of "Explained Effect" with fewer attention heads than its standard counterpart (blue or green line). The curves for sparse models are always to the left/above.
2. **Task-Dependent Efficiency Gains:** The magnitude of the efficiency gain (the multiplier) varies significantly by task. The gain is most pronounced on the "IOI" task for GPT-2 (2.0x) and least pronounced on the "Greater Than" task (0.6x, which is actually a slowdown, meaning Sparse GPT-2 needed *more* heads at that specific performance point).
3. **Different X-Axis Scales:** The GPT-2 models (left charts) are evaluated on keeping up to ~120 heads, while the OLMo-7B models (right charts) are evaluated on a scale up to 1000 heads, suggesting OLMo-7B has a much larger total number of attention heads.
4. **Performance Plateau:** All models eventually reach an Explained Effect of 1.0 (or very near it), indicating that with enough heads, full performance is recovered. The sparse models reach this plateau earlier.
### Interpretation
These charts demonstrate the effectiveness of a "sparsification" technique applied to language models. The technique aims to identify and retain only the most important attention heads, allowing for model compression or more efficient inference without sacrificing performance on specific tasks.
* **What the data suggests:** The sparse models are more "head-efficient." They achieve the same task performance (Explained Effect) with a smaller subset of attention heads. This implies the sparsification method successfully identifies a core set of functionally important heads.
* **How elements relate:** The "Explained Effect" metric likely measures how well the model's behavior on a task can be predicted or reconstructed using only the kept heads. The x-axis shows the cost (number of heads). The curves show the trade-off: keeping more heads improves performance, but sparse models offer a better trade-off.
* **Notable Anomalies:** The "Greater Than" task shows a 0.6x multiplier, meaning the sparse model was *less* efficient at that specific operating point (~85% performance). This could indicate that for this particular, possibly simpler task, the sparsification heuristic was suboptimal, or that the standard model's heads are more uniformly useful. However, the sparse model still reaches full performance eventually.
* **Broader Implication:** The varying multipliers (0.6x to 2.0x) highlight that the benefit of sparsification is highly task-dependent. A model compressed for one task (like IOI) may see dramatic efficiency gains, while gains on another task (like Greater Than) may be minimal or even negative at certain performance thresholds. This underscores the importance of task-aware model compression.
DECODING INTELLIGENCE...