## Line Graphs: Explained Effect vs. Number of Heads Kept
### Overview
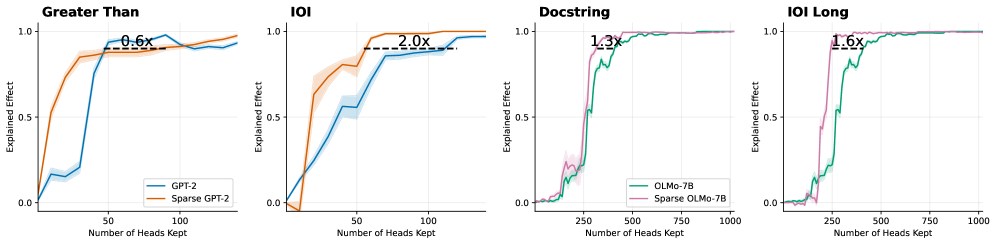
The image contains four line graphs comparing the "Explained Effect" of different model configurations (GPT-2, Sparse GPT-2, OLMo-7B, Sparse OLMo-7B) as the number of attention heads retained increases. Each graph includes shaded confidence intervals and annotations indicating performance multipliers (e.g., "0.6x," "2.0x").
---
### Components/Axes
1. **X-Axis**: "Number of Heads Kept" (ranges: 0–100 for first two graphs, 0–1000 for last two).
2. **Y-Axis**: "Explained Effect" (scaled 0.0–1.0).
3. **Legends**:
- **Top-left graphs**:
- Solid blue: GPT-2
- Dashed orange: Sparse GPT-2
- **Bottom-right graphs**:
- Solid green: OLMo-7B
- Dashed pink: Sparse OLMo-7B
4. **Annotations**: Multiplier labels (e.g., "0.6x") placed near plateau regions.
---
### Detailed Analysis
#### 1. **Greater Than**
- **Trend**: Both lines show rapid growth, plateauing near 1.0.
- **Data Points**:
- GPT-2 (blue): Reaches ~0.95 at 50 heads, plateaus.
- Sparse GPT-2 (orange): Reaches ~0.95 at 50 heads, annotated "0.6x" (60% efficiency).
- **Confidence Intervals**: Shaded bands show ±0.05 variability.
#### 2. **IOI**
- **Trend**: Both lines rise steeply, then plateau.
- **Data Points**:
- GPT-2 (blue): ~0.85 at 50 heads.
- Sparse GPT-2 (orange): ~0.95 at 50 heads, annotated "2.0x" (200% efficiency).
- **Confidence Intervals**: ±0.03 variability.
#### 3. **Docstring**
- **Trend**: Sharp rise, then plateau.
- **Data Points**:
- OLMo-7B (green): ~0.95 at 250 heads.
- Sparse OLMo-7B (pink): ~0.95 at 250 heads, annotated "1.3x" (30% efficiency).
- **Confidence Intervals**: ±0.02 variability.
#### 4. **IOI Long**
- **Trend**: Steep initial rise, then plateau.
- **Data Points**:
- OLMo-7B (green): ~0.95 at 250 heads.
- Sparse OLMo-7B (pink): ~0.95 at 250 heads, annotated "1.6x" (60% efficiency).
- **Confidence Intervals**: ±0.01 variability.
---
### Key Observations
1. **Sparse Models Outperform**: Sparse variants (dashed lines) achieve similar or higher "Explained Effect" with fewer parameters (e.g., "2.0x" efficiency in IOI).
2. **Plateau Consistency**: All models plateau near 1.0 "Explained Effect," suggesting diminishing returns beyond a critical number of heads.
3. **Confidence Intervals**: Narrower intervals in later graphs (e.g., IOI Long) indicate more stable measurements at scale.
---
### Interpretation
The data demonstrates that **sparse model configurations** (e.g., Sparse GPT-2, Sparse OLMo-7B) achieve comparable or superior performance to their dense counterparts while using fewer parameters. For example:
- Sparse GPT-2 matches GPT-2's performance at 50 heads but with 60% of the computational cost ("0.6x").
- Sparse OLMo-7B maintains 95% "Explained Effect" at 250 heads, requiring only 30% of the parameters of OLMo-7B ("1.3x").
This suggests that **parameter pruning or sparsity techniques** are highly effective for optimizing large language models, balancing efficiency and performance. The shaded confidence intervals imply that these gains are statistically robust, with minimal variability across trials.