## Bar Chart: Latency Comparison Between FP16 and w8a8 Methods
### Overview
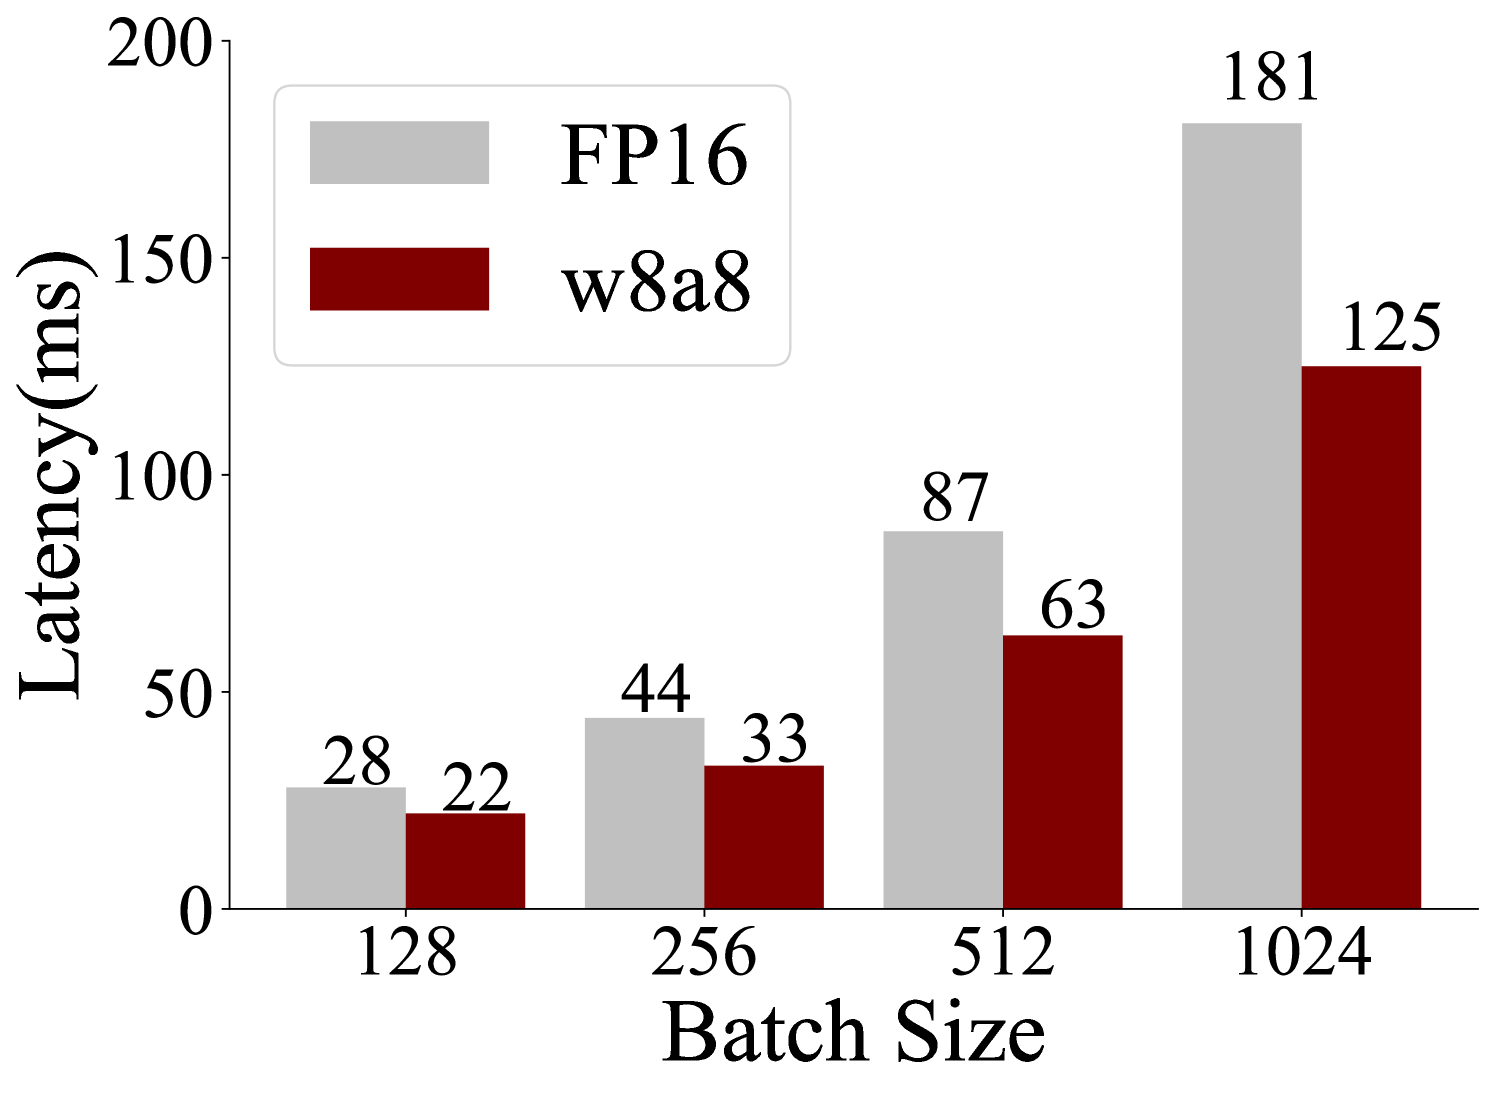
The chart compares latency (in milliseconds) for two computational methods, **FP16** (gray bars) and **w8a8** (red bars), across four batch sizes: 128, 256, 512, and 1024. Latency increases with batch size for both methods, but FP16 exhibits steeper growth.
### Components/Axes
- **X-axis (Batch Size)**: Labeled with values 128, 256, 512, 1024.
- **Y-axis (Latency)**: Labeled "Latency (ms)" with a range from 0 to 200.
- **Legend**: Located in the top-left corner, associating gray with FP16 and red with w8a8.
- **Bars**: Paired bars for each batch size, with numerical labels on top.
### Detailed Analysis
- **Batch Size 128**:
- FP16: 28 ms
- w8a8: 22 ms
- **Batch Size 256**:
- FP16: 44 ms
- w8a8: 33 ms
- **Batch Size 512**:
- FP16: 87 ms
- w8a8: 63 ms
- **Batch Size 1024**:
- FP16: 181 ms
- w8a8: 125 ms
### Key Observations
1. **FP16 Latency**: Increases non-linearly, with a sharp jump from 87 ms (512) to 181 ms (1024).
2. **w8a8 Latency**: Grows more gradually, maintaining a ~20–30 ms advantage over FP16 at all batch sizes.
3. **Scalability**: FP16 latency scales poorly at larger batches (e.g., 1024 is 2.08x slower than 512), while w8a8 scales more efficiently (1024 is 1.89x slower than 512).
### Interpretation
The data suggests **w8a8** is more scalable than FP16 for larger batch sizes, likely due to optimized precision handling (e.g., 8-bit quantization). FP16’s quadratic-like latency growth at 1024 indicates potential bottlenecks in memory or computation for high-precision operations. This trend is critical for applications prioritizing efficiency in large-scale processing.