## Bar Chart: Latency vs. Batch Size
### Overview
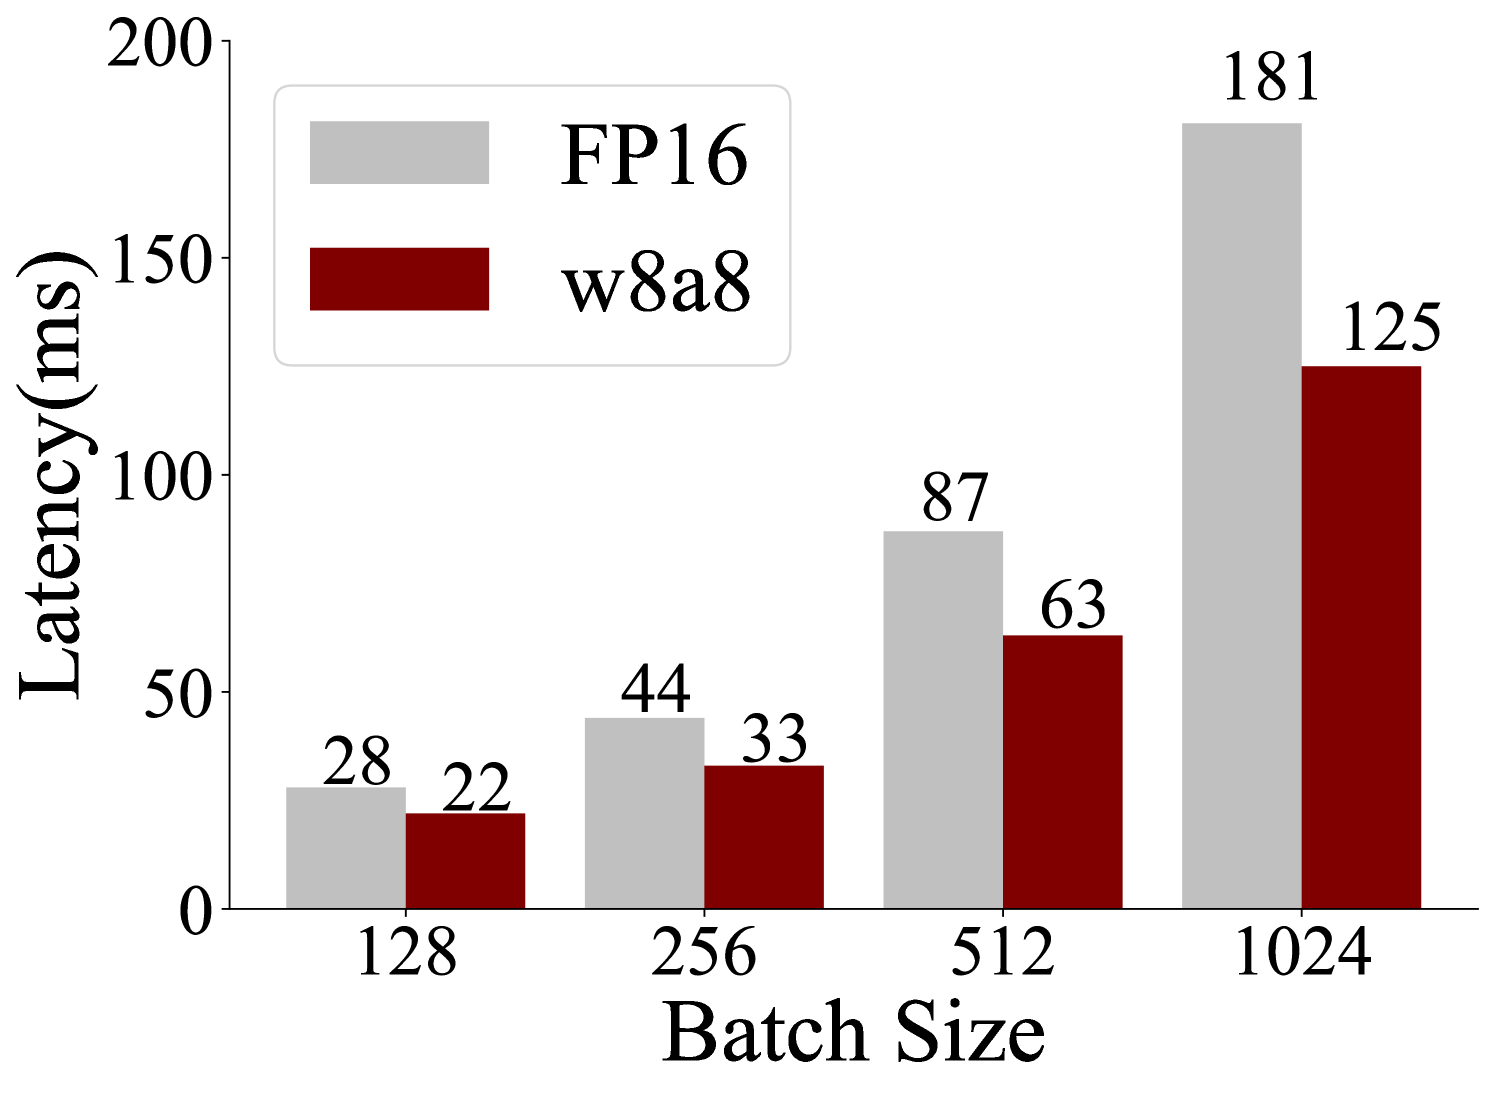
The image is a bar chart comparing the latency (in milliseconds) of two different configurations, FP16 and w8a8, across varying batch sizes (128, 256, 512, and 1024). The chart visually represents how latency increases with batch size for both configurations.
### Components/Axes
* **X-axis:** Batch Size, with values 128, 256, 512, and 1024.
* **Y-axis:** Latency (ms), ranging from 0 to 200.
* **Legend:** Located in the top-left corner.
* FP16: Represented by light gray bars.
* w8a8: Represented by dark red bars.
### Detailed Analysis
The chart presents latency values for FP16 and w8a8 at different batch sizes.
* **Batch Size 128:**
* FP16: Latency is approximately 28 ms.
* w8a8: Latency is approximately 22 ms.
* **Batch Size 256:**
* FP16: Latency is approximately 44 ms.
* w8a8: Latency is approximately 33 ms.
* **Batch Size 512:**
* FP16: Latency is approximately 87 ms.
* w8a8: Latency is approximately 63 ms.
* **Batch Size 1024:**
* FP16: Latency is approximately 181 ms.
* w8a8: Latency is approximately 125 ms.
**Trend Verification:**
Both FP16 and w8a8 show an upward trend in latency as the batch size increases.
### Key Observations
* For all batch sizes, w8a8 has lower latency than FP16.
* The difference in latency between FP16 and w8a8 increases as the batch size increases. The difference is most pronounced at a batch size of 1024.
### Interpretation
The chart demonstrates that the w8a8 configuration results in lower latency compared to FP16 across all tested batch sizes. The performance gap between the two configurations widens significantly as the batch size increases, suggesting that w8a8 scales more efficiently with larger batch sizes. This could be due to the quantization benefits of w8a8, which may lead to faster computation and memory access, especially at larger scales.