\n
## Bar Chart: Latency vs. Batch Size for FP16 and w8a8
### Overview
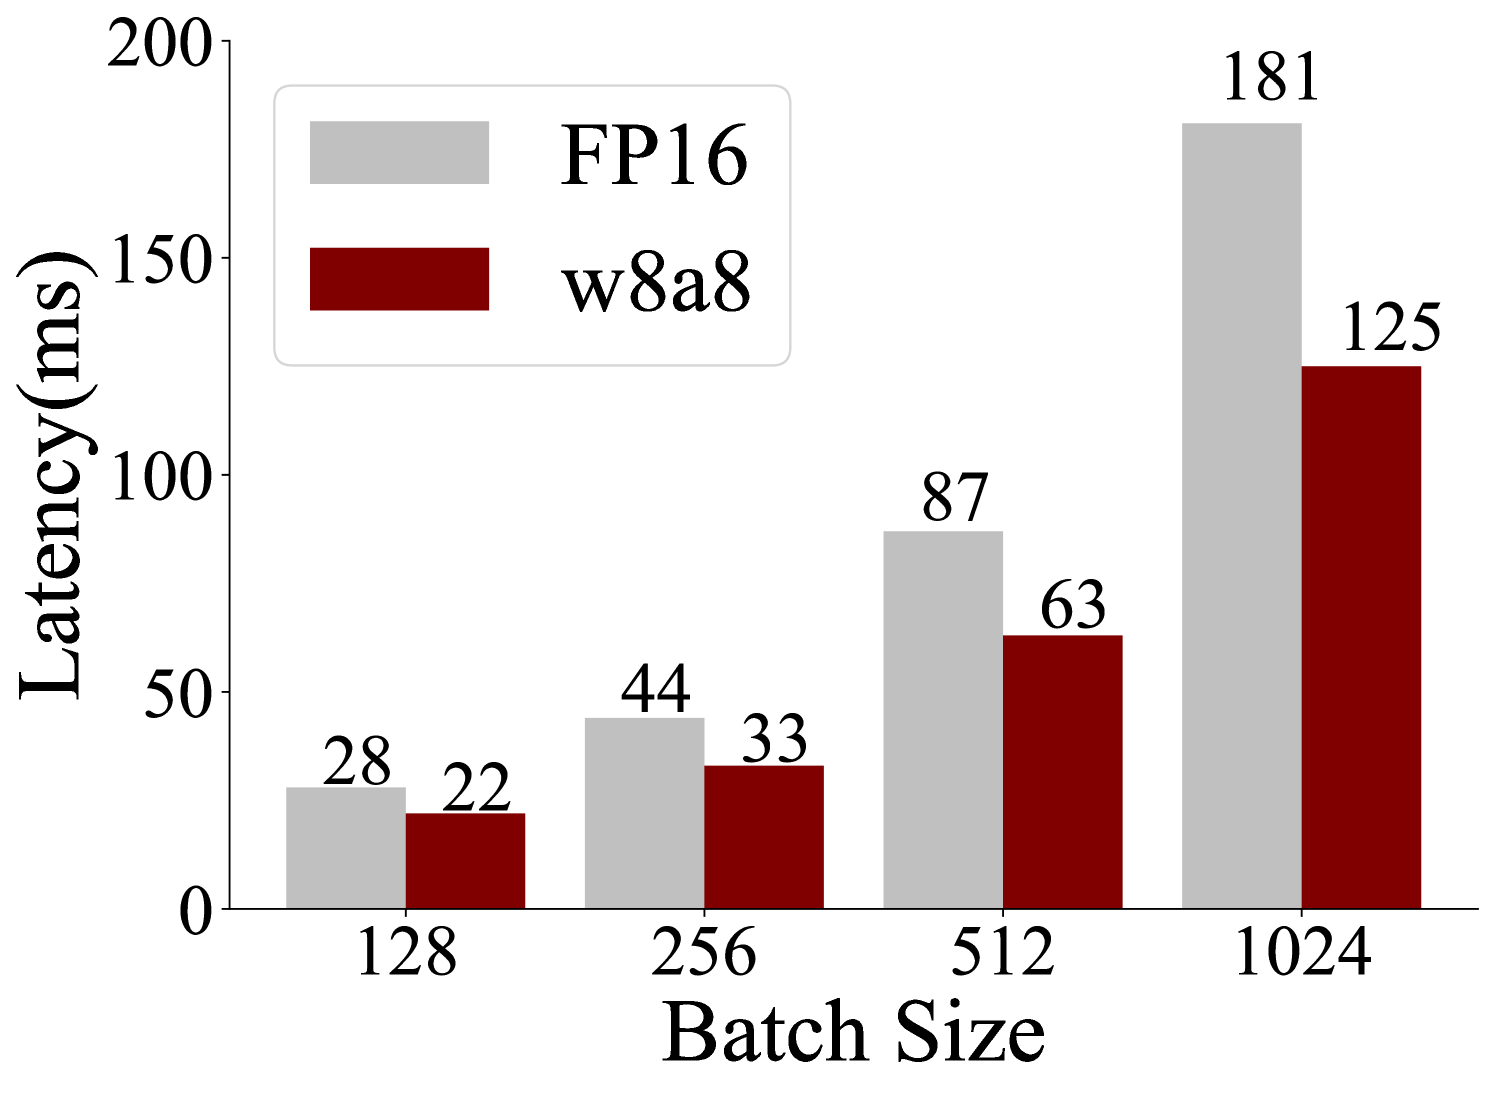
This bar chart compares the latency (in milliseconds) of two data types, FP16 and w8a8, across different batch sizes. The batch sizes are 128, 256, 512, and 1024. Each batch size has two bars representing the latency for each data type.
### Components/Axes
* **X-axis:** Batch Size (labeled as "Batch Size"). Markers are 128, 256, 512, and 1024.
* **Y-axis:** Latency (in milliseconds) (labeled as "Latency(ms)"). Scale ranges from 0 to 200.
* **Legend:** Located at the top-left corner.
* FP16: Represented by light gray bars.
* w8a8: Represented by dark red bars.
### Detailed Analysis
The chart consists of paired bars for each batch size, representing FP16 and w8a8 latency.
* **Batch Size 128:**
* FP16: Approximately 28 ms.
* w8a8: Approximately 22 ms.
* **Batch Size 256:**
* FP16: Approximately 44 ms.
* w8a8: Approximately 33 ms.
* **Batch Size 512:**
* FP16: Approximately 87 ms.
* w8a8: Approximately 63 ms.
* **Batch Size 1024:**
* FP16: Approximately 181 ms.
* w8a8: Approximately 125 ms.
**Trends:**
* For both FP16 and w8a8, the latency generally increases as the batch size increases. This is expected, as larger batch sizes require more computation.
* At all batch sizes, w8a8 consistently exhibits lower latency than FP16. The difference in latency between the two data types appears to increase as the batch size increases.
### Key Observations
* w8a8 consistently outperforms FP16 in terms of latency across all batch sizes.
* The latency increase is more pronounced for FP16 as the batch size grows.
* The difference between FP16 and w8a8 latency is smallest at a batch size of 128 (approximately 6 ms) and largest at a batch size of 1024 (approximately 56 ms).
### Interpretation
The data suggests that using the w8a8 data type results in lower latency compared to FP16, particularly as the batch size increases. This indicates that w8a8 is a more efficient data type for this workload, especially when processing larger batches of data. The increasing latency with larger batch sizes is a common phenomenon in deep learning, as it reflects the increased computational cost. The consistent performance advantage of w8a8 suggests that it may be a valuable optimization technique for reducing latency in this scenario. The chart demonstrates a clear trade-off between batch size and latency, and highlights the potential benefits of using lower-precision data types like w8a8 to improve performance.