\n
## Diagram: Data Processing Pipeline
### Overview
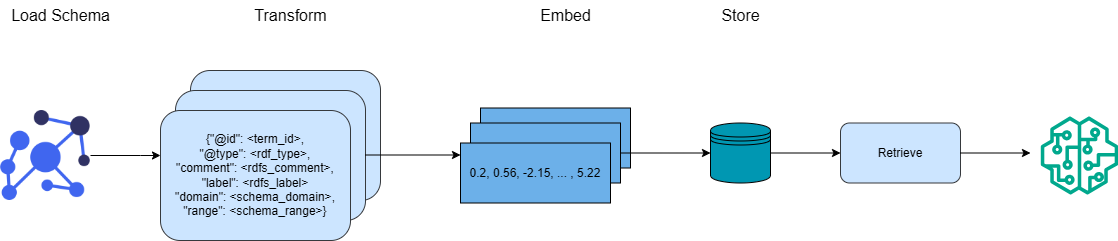
The image depicts a data processing pipeline with four stages: Load Schema, Transform, Embed, and Store. It illustrates the flow of data from an initial schema representation through transformation, embedding, storage, and retrieval. The diagram uses simplified visual representations of data and processing steps.
### Components/Axes
The diagram consists of four main components, labeled sequentially from left to right:
1. **Load Schema:** Represented by a network of blue circles connected by lines.
2. **Transform:** Represented by a light-blue rounded rectangle containing a block of text formatted as a JSON object.
3. **Embed:** Represented by a light-blue rectangle containing a series of numerical values.
4. **Store:** Represented by a teal cylinder, followed by a light-blue rectangle labeled "Retrieve".
The stages are connected by arrows indicating the direction of data flow. Above each component is a label indicating the stage name.
### Detailed Analysis or Content Details
Let's examine each stage in detail:
* **Load Schema:** This stage shows a network of interconnected nodes, suggesting a graph-like data structure. The nodes are blue circles.
* **Transform:** The text within the light-blue rounded rectangle is a JSON-like structure. The keys are:
* `@id`: `<term_id>`
* `@type`: `<rdf_type>`
* `comment`: `<rdfs_comment>`
* `label`: `<rdfs_label>`
* `domain`: `<schema_domain>`
* `range`: `<schema_range>`
The values are placeholders enclosed in angle brackets.
* **Embed:** The light-blue rectangle contains the following numerical values: `0.2, 0.56, -2.15, ..., 5.22`. The ellipsis indicates that there are more values not shown.
* **Store:** A teal cylinder represents the storage component. An arrow leads from the cylinder to a light-blue rectangle labeled "Retrieve". This suggests a retrieval process after storage.
### Key Observations
The diagram illustrates a typical data pipeline. The "Transform" stage suggests a conversion of the initial schema into a structured format (JSON). The "Embed" stage represents a numerical representation of the transformed data, potentially for machine learning or similarity calculations. The "Store" and "Retrieve" stages indicate data persistence and access. The ellipsis in the "Embed" stage suggests a potentially high-dimensional embedding space.
### Interpretation
This diagram likely represents a process for converting data from a semantic web format (indicated by the RDF-like keys in the "Transform" stage) into a numerical embedding for use in a downstream application. The pipeline suggests a workflow where data is first loaded from a schema, transformed into a structured format, embedded into a vector space, stored, and then retrieved for use. The use of RDF terms suggests the data may originate from a knowledge graph. The embedding stage is crucial for enabling machine learning tasks such as similarity search or classification. The diagram is a high-level overview and does not provide details about the specific algorithms or technologies used in each stage.