# Technical Document Extraction: DeepSeekMoE 16B vs. DeepSeek 7B Performance Comparison
This document provides a comprehensive extraction of data from a grid of 18 line charts comparing the performance of two AI models over the course of training.
## 1. General Metadata and Global Parameters
* **Image Type:** A 6x3 grid of performance line charts.
* **X-Axis (All Charts):** `# Training Tokens (B)`
* **Range:** 0 to 2000 Billion tokens.
* **Markers:** 0, 500, 1000, 1500, 2000.
* **Y-Axis (All Charts):** `Performance`
* **Scale:** Linear, varies per benchmark (see individual chart details).
* **Legend (All Charts):**
* **DeepSeekMoE 16B:** Represented by an **Orange** line.
* **DeepSeek 7B (Dense):** Represented by a **Blue** line.
* **Spatial Placement:** Bottom-right quadrant of each individual plot.
---
## 2. Individual Chart Data Extraction
The charts are processed row-by-row, from left to right.
### Row 1: General Reasoning & Knowledge
| Benchmark Title | Y-Axis Range | Trend Description | Comparative Analysis |
| :--- | :--- | :--- | :--- |
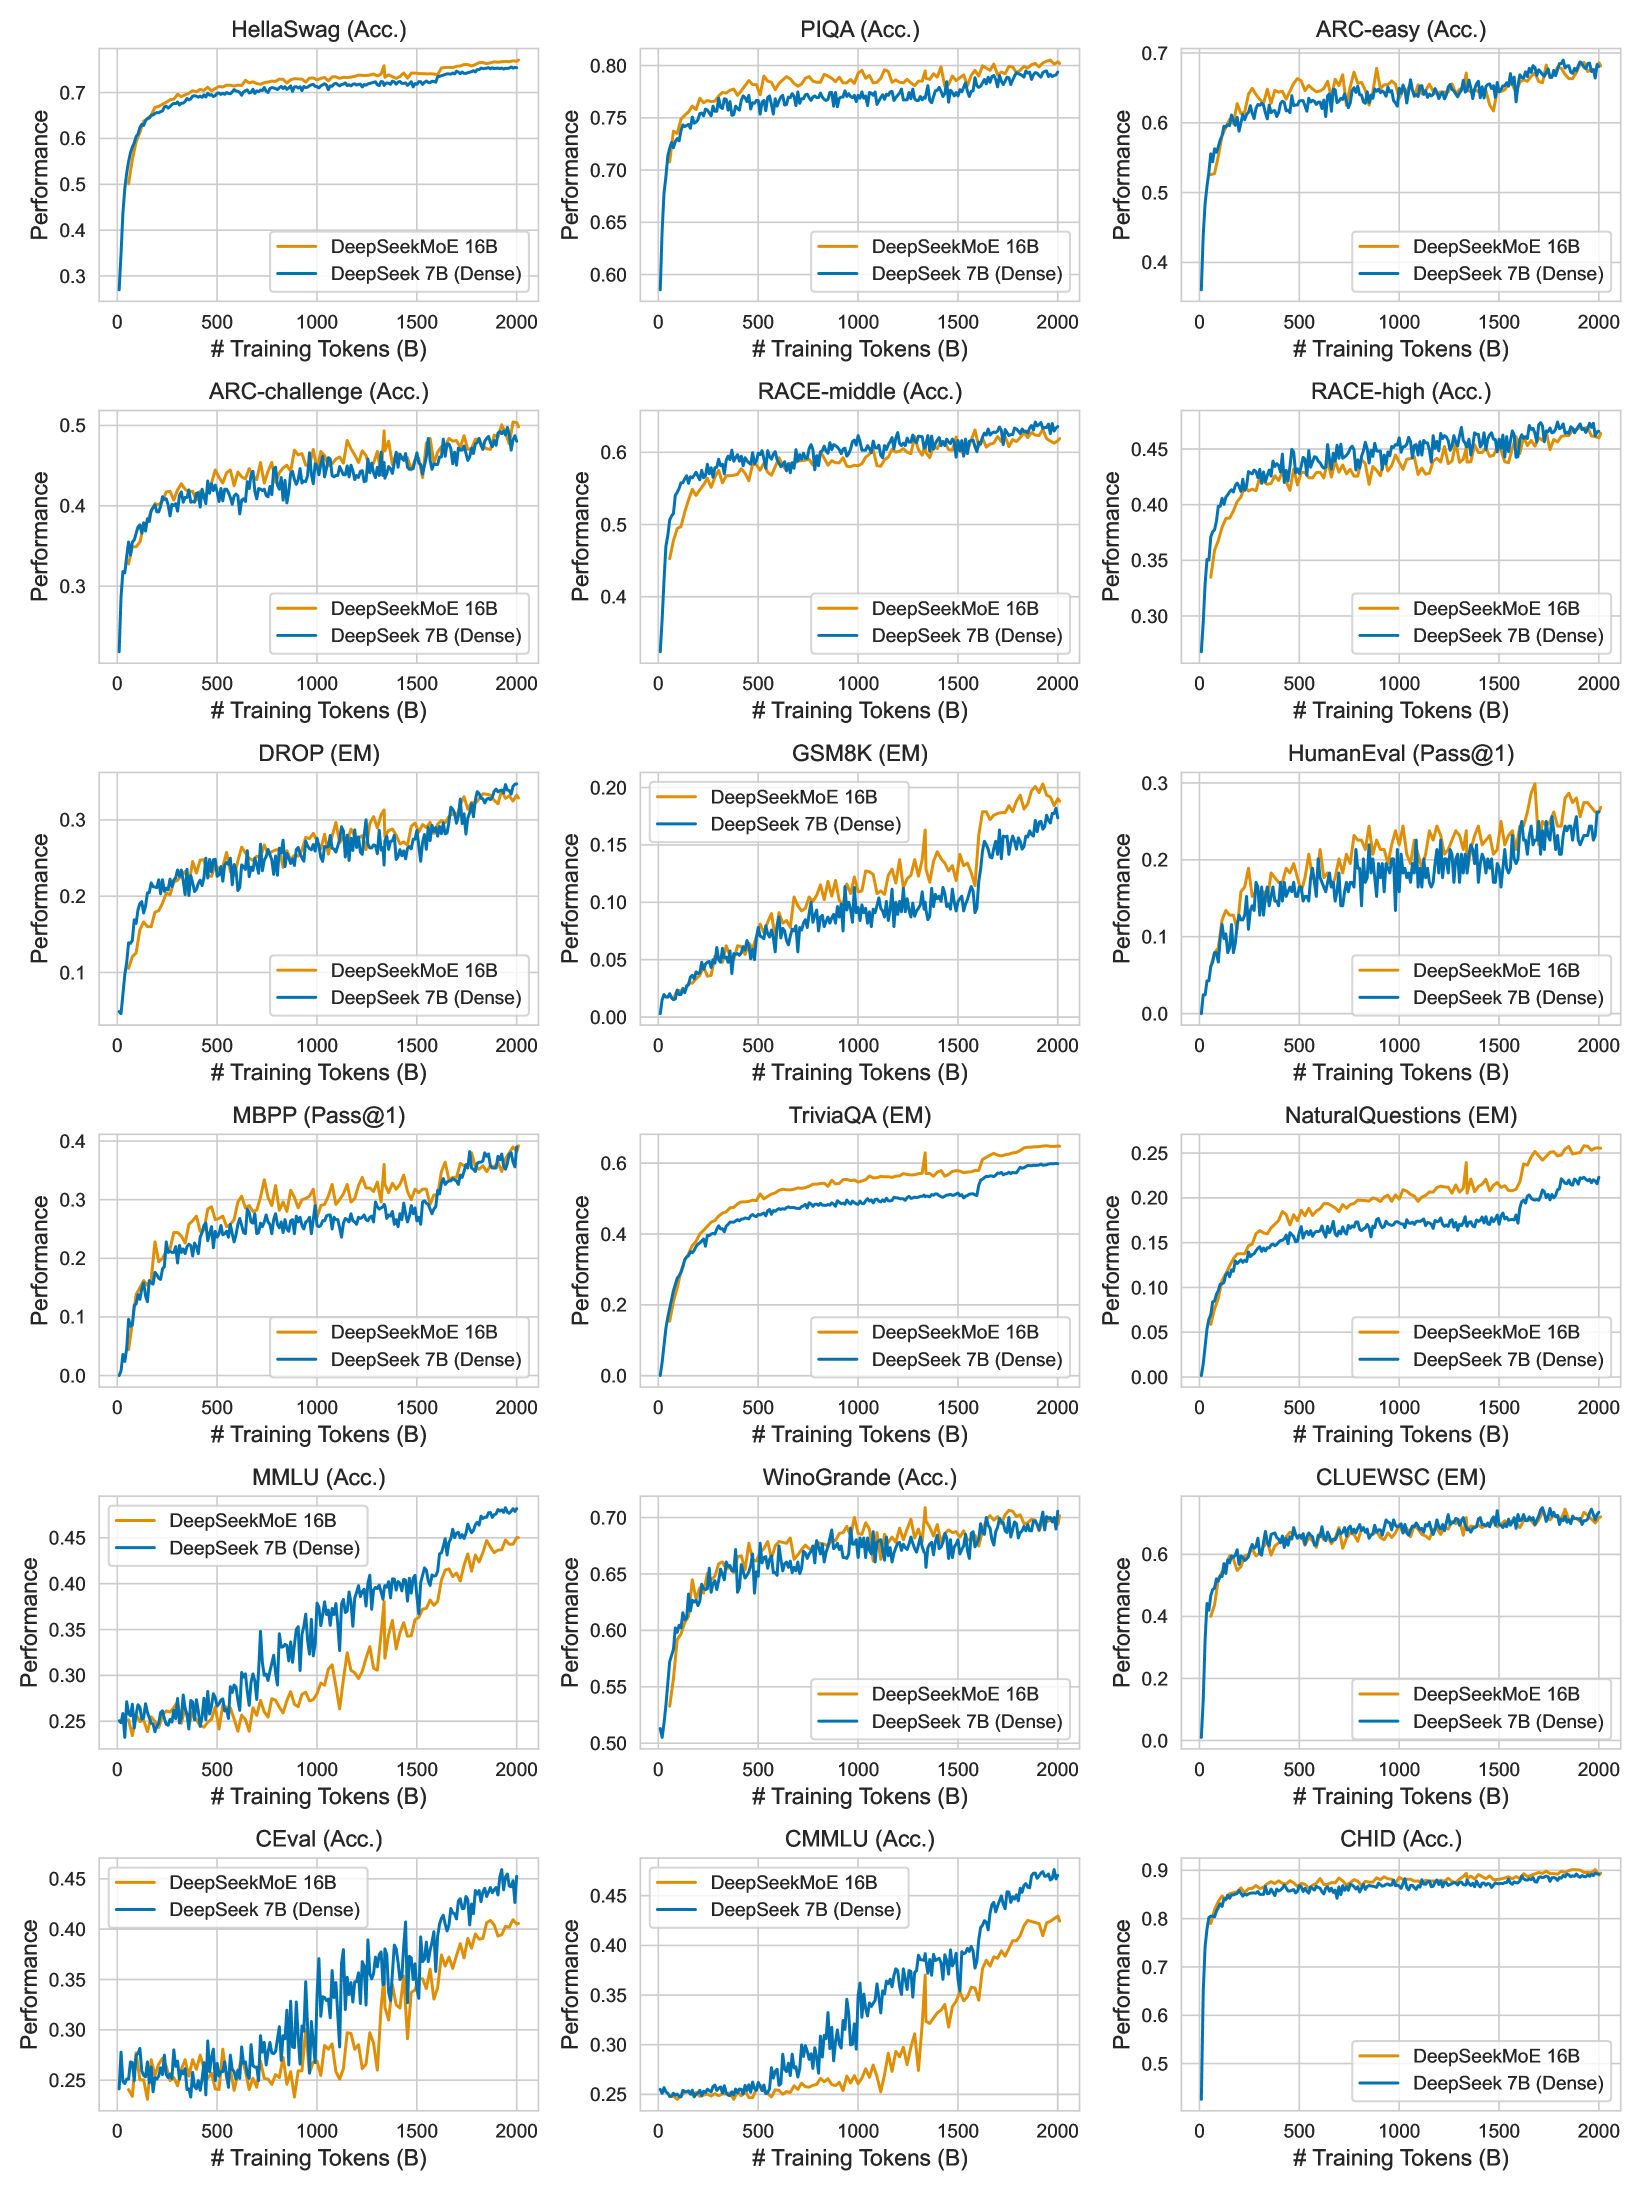
| **HellaSwag (Acc.)** | 0.3 - 0.7 | Both lines show logarithmic growth, plateauing after 1000B tokens. | **Orange** consistently maintains a slight lead (~0.02-0.03) over **Blue** until the very end where they converge near 0.75. |
| **PIQA (Acc.)** | 0.60 - 0.80 | Rapid initial growth followed by high-variance fluctuations. | **Orange** stays slightly above **Blue** for the majority of training, peaking near 0.80. |
| **ARC-easy (Acc.)** | 0.4 - 0.7 | Steady upward trend with significant noise. | Both models perform similarly, oscillating around each other. Both finish near 0.68. |
### Row 2: Academic & Reasoning
| Benchmark Title | Y-Axis Range | Trend Description | Comparative Analysis |
| :--- | :--- | :--- | :--- |
| **ARC-challenge (Acc.)** | 0.2 - 0.5 | Linear-logarithmic growth. | **Orange** and **Blue** are tightly coupled. **Orange** shows slightly higher peaks in the mid-training phase. |
| **RACE-middle (Acc.)** | 0.4 - 0.6 | Rapid rise in first 250B, then slow steady climb. | **Blue** and **Orange** are nearly identical, finishing at approximately 0.64. |
| **RACE-high (Acc.)** | 0.30 - 0.45 | Steady upward slope. | **Blue** starts slightly higher; **Orange** catches up by 1000B. Both finish near 0.47. |
### Row 3: Reading Comprehension & Coding
| Benchmark Title | Y-Axis Range | Trend Description | Comparative Analysis |
| :--- | :--- | :--- | :--- |
| **DROP (EM)** | 0.1 - 0.3 | Strong upward trend with high variance. | **Blue** leads slightly in the first half; **Orange** matches or exceeds it in the final 500B tokens. |
| **GSM8K (EM)** | 0.00 - 0.20 | Jittery upward trend; growth accelerates after 1500B. | **Orange** shows a distinct advantage over **Blue** after 1500B tokens, reaching 0.20 while Blue is at ~0.17. |
| **HumanEval (Pass@1)** | 0.0 - 0.3 | Extremely high variance (spiky) upward trend. | **Orange** generally maintains higher peaks than **Blue** throughout the training duration. |
### Row 4: Knowledge & QA
| Benchmark Title | Y-Axis Range | Trend Description | Comparative Analysis |
| :--- | :--- | :--- | :--- |
| **MBPP (Pass@1)** | 0.0 - 0.4 | High variance, steady climb. | **Orange** leads significantly between 500B-1500B tokens. Both converge at ~0.38 at 2000B. |
| **TriviaQA (EM)** | 0.0 - 0.6 | Smooth logarithmic curve. | **Orange** shows a clear and consistent lead over **Blue** from 250B tokens onward. |
| **NaturalQuestions (EM)** | 0.00 - 0.25 | Smooth logarithmic curve. | **Orange** significantly outperforms **Blue** throughout the entire training process. |
### Row 5: Multi-task & Linguistic (Chinese/English)
| Benchmark Title | Y-Axis Range | Trend Description | Comparative Analysis |
| :--- | :--- | :--- | :--- |
| **MMLU (Acc.)** | 0.25 - 0.45 | Late-stage acceleration. | **Blue** (Dense) significantly outperforms **Orange** (MoE) after 1000B tokens. |
| **WinoGrande (Acc.)** | 0.50 - 0.70 | Rapid initial rise, then plateau with noise. | Both models are neck-and-neck, finishing around 0.69. |
| **CLUEWSC (EM)** | 0.0 - 0.6 | Rapid rise to 0.6, then flat. | Both models perform almost identically, plateauing early. |
### Row 6: Chinese Benchmarks
| Benchmark Title | Y-Axis Range | Trend Description | Comparative Analysis |
| :--- | :--- | :--- | :--- |
| **CEval (Acc.)** | 0.25 - 0.45 | Steady climb with high variance. | **Blue** (Dense) maintains a consistent lead over **Orange** (MoE) after 750B tokens. |
| **CMMLU (Acc.)** | 0.25 - 0.45 | Steady climb. | **Blue** (Dense) shows a widening lead over **Orange** (MoE) as training progresses. |
| **CHID (Acc.)** | 0.5 - 0.9 | Very rapid initial rise, then near-total plateau. | Both models are identical, plateauing at ~0.88. |
---
## 3. Summary of Trends
* **DeepSeekMoE 16B (Orange) Strengths:** Shows superior performance in Reading Comprehension and Question Answering tasks like *TriviaQA*, *NaturalQuestions*, and *GSM8K*.
* **DeepSeek 7B Dense (Blue) Strengths:** Shows a clear advantage in multi-task knowledge benchmarks, specifically *MMLU*, *CEval*, and *CMMLU*.
* **Parity:** On many standard reasoning benchmarks (*HellaSwag*, *ARC*, *RACE*, *WinoGrande*), the two architectures perform nearly identically despite the difference in total parameters vs. active parameters.
* **Convergence:** Most benchmarks show that performance has not yet fully plateaued at 2000B tokens, suggesting further gains are possible with more training.