TECHNICAL ASSET FINGERPRINT
eddee48fd282fd08b8811d73
Click to view fullscreen
Press ESC or click to close
FOUND IN PAPERS
EXPERT: gemini-2.0-flash VERSION 1
RUNTIME: nugit/gemini/gemini-2.0-flash
INTEL_VERIFIED
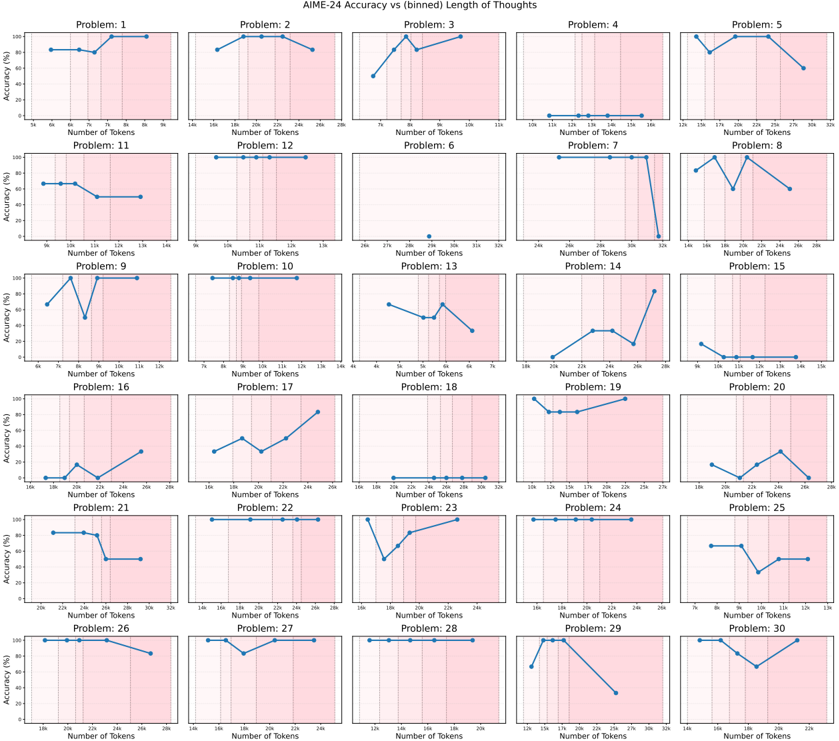
## Chart: AIME-24 Accuracy vs (binned) Length of Thoughts
### Overview
The image presents a series of 30 line charts arranged in a 6x5 grid. Each chart displays the accuracy (%) on the y-axis versus the number of tokens (in thousands) on the x-axis for a specific problem from AIME-24. The x-axis is divided into bins, and the background of each chart is shaded with a gradient, transitioning from white to light pink.
### Components/Axes
* **Title:** AIME-24 Accuracy vs (binned) Length of Thoughts
* **X-axis:** Number of Tokens (in thousands, denoted by 'k')
* The x-axis scale varies slightly between charts, but generally spans a range of token counts.
* Example x-axis markers: 5k, 6k, 7k, 8k, 9k (Problem 1); 14k, 16k, 18k, 20k, 22k, 24k, 26k (Problem 2)
* **Y-axis:** Accuracy (%)
* Scale: 0 to 100
* Markers: 0, 20, 40, 60, 80, 100
* **Chart Titles:** Problem: 1, Problem: 2, ..., Problem: 30 (located at the top of each individual chart)
* **Background:** Gradient shading from white to light pink.
### Detailed Analysis
Each chart represents a problem, and the line shows how accuracy changes with the number of tokens used.
**Problem 1:**
* Trend: Accuracy is high (around 80-90%) for lower token counts (5k-7k), then increases to 100% around 8k-9k.
* Data Points: Approximately (5k, 85%), (6k, 85%), (7k, 90%), (8k, 100%), (9k, 100%)
**Problem 2:**
* Trend: Accuracy starts high (around 90-95%) at 14k tokens, peaks at 100% around 18k-20k, then decreases slightly to around 90% at 26k tokens.
* Data Points: Approximately (14k, 95%), (16k, 95%), (18k, 100%), (20k, 100%), (22k, 95%), (24k, 90%), (26k, 90%)
**Problem 3:**
* Trend: Accuracy increases from approximately 50% at 7k tokens to nearly 100% at 9k tokens, then remains high at 100% until 11k tokens.
* Data Points: Approximately (7k, 50%), (8k, 90%), (9k, 100%), (11k, 100%)
**Problem 4:**
* Trend: Accuracy remains very low (near 0%) across all token counts.
* Data Points: Approximately (10k, 0%), (11k, 0%), (12k, 0%), (13k, 0%), (14k, 0%), (15k, 0%), (16k, 0%), (17k, 0%), (18k, 0%), (19k, 0%), (20k, 0%), (21k, 0%), (22k, 0%), (23k, 0%), (24k, 0%), (25k, 0%), (26k, 0%), (27k, 0%), (28k, 0%), (29k, 0%), (30k, 0%), (31k, 0%), (32k, 0%)
**Problem 5:**
* Trend: Accuracy increases from approximately 60% at 18k tokens to nearly 100% at 20k tokens, then remains high at 100% until 30k tokens.
* Data Points: Approximately (18k, 60%), (20k, 95%), (22k, 100%), (24k, 100%), (26k, 100%), (28k, 100%), (30k, 100%)
**Problem 6:**
* Trend: Accuracy remains very low (near 0%) across all token counts.
* Data Points: Approximately (27k, 0%), (28k, 0%), (29k, 0%), (30k, 0%), (31k, 0%), (32k, 0%)
**Problem 7:**
* Trend: Accuracy is high (100%) until 30k tokens, then drops to 0% at 32k tokens.
* Data Points: Approximately (26k, 100%), (27k, 100%), (28k, 100%), (29k, 100%), (30k, 100%), (31k, 100%), (32k, 0%)
**Problem 8:**
* Trend: Accuracy fluctuates, starting around 60% at 12k tokens, peaking at 100% around 22k tokens, and ending around 80% at 26k tokens.
* Data Points: Approximately (12k, 60%), (14k, 70%), (16k, 90%), (18k, 80%), (20k, 90%), (22k, 100%), (24k, 90%), (26k, 80%)
**Problem 9:**
* Trend: Accuracy increases sharply from approximately 70% at 6k tokens to 100% at 8k tokens, then remains high at 100% until 12k tokens.
* Data Points: Approximately (6k, 70%), (7k, 90%), (8k, 100%), (9k, 100%), (10k, 100%), (11k, 100%), (12k, 100%)
**Problem 10:**
* Trend: Accuracy remains high (100%) across all token counts.
* Data Points: Approximately (7k, 100%), (8k, 100%), (9k, 100%), (10k, 100%), (11k, 100%), (12k, 100%), (13k, 100%)
**Problem 11:**
* Trend: Accuracy starts high (around 70%) at 10k tokens, then decreases to around 50% at 12k tokens, and remains at 50% until 14k tokens.
* Data Points: Approximately (10k, 70%), (11k, 60%), (12k, 50%), (13k, 50%), (14k, 50%)
**Problem 12:**
* Trend: Accuracy remains high (100%) across all token counts.
* Data Points: Approximately (10k, 100%), (11k, 100%), (12k, 100%), (13k, 100%)
**Problem 13:**
* Trend: Accuracy decreases from approximately 80% at 4k tokens to 40% at 5k tokens, then increases to 60% at 6k tokens.
* Data Points: Approximately (4k, 80%), (5k, 40%), (6k, 60%), (7k, 50%)
**Problem 14:**
* Trend: Accuracy increases from approximately 0% at 20k tokens to 80% at 26k tokens.
* Data Points: Approximately (20k, 0%), (22k, 20%), (24k, 40%), (26k, 80%)
**Problem 15:**
* Trend: Accuracy remains very low (near 0%) across all token counts.
* Data Points: Approximately (9k, 0%), (10k, 0%), (11k, 0%), (12k, 0%), (13k, 0%), (14k, 0%), (15k, 0%)
**Problem 16:**
* Trend: Accuracy remains very low (near 0%) across all token counts.
* Data Points: Approximately (16k, 0%), (17k, 10%), (18k, 20%), (19k, 10%), (20k, 0%)
**Problem 17:**
* Trend: Accuracy increases from approximately 40% at 16k tokens to 80% at 24k tokens.
* Data Points: Approximately (16k, 40%), (18k, 60%), (20k, 50%), (22k, 70%), (24k, 80%)
**Problem 18:**
* Trend: Accuracy remains very low (near 0%) across all token counts.
* Data Points: Approximately (16k, 0%), (18k, 0%), (20k, 0%), (22k, 0%), (24k, 0%), (26k, 0%), (28k, 0%), (30k, 0%), (32k, 0%)
**Problem 19:**
* Trend: Accuracy remains relatively constant at approximately 80% across all token counts.
* Data Points: Approximately (12k, 80%), (14k, 80%), (16k, 80%), (18k, 80%), (20k, 80%), (22k, 80%), (24k, 80%), (26k, 80%), (28k, 80%)
**Problem 20:**
* Trend: Accuracy fluctuates, starting around 10% at 18k tokens, peaking at 30% around 24k tokens, and ending around 10% at 28k tokens.
* Data Points: Approximately (18k, 10%), (20k, 20%), (22k, 20%), (24k, 30%), (26k, 20%), (28k, 10%)
**Problem 21:**
* Trend: Accuracy is high (around 80-90%) for lower token counts (20k-24k), then decreases to 50% around 26k-32k.
* Data Points: Approximately (20k, 90%), (22k, 90%), (24k, 80%), (26k, 50%), (28k, 50%), (30k, 50%), (32k, 50%)
**Problem 22:**
* Trend: Accuracy remains high (100%) across all token counts.
* Data Points: Approximately (20k, 100%), (22k, 100%), (24k, 100%), (26k, 100%)
**Problem 23:**
* Trend: Accuracy increases from approximately 40% at 16k tokens to 100% at 20k tokens, then remains high at 100% until 26k tokens.
* Data Points: Approximately (16k, 40%), (18k, 80%), (20k, 100%), (22k, 100%), (24k, 100%), (26k, 100%)
**Problem 24:**
* Trend: Accuracy remains high (100%) across all token counts.
* Data Points: Approximately (12k, 100%), (13k, 100%)
**Problem 25:**
* Trend: Accuracy decreases from approximately 80% at 9k tokens to 20% at 11k tokens, then increases to 40% at 12k tokens, and decreases to 30% at 13k tokens.
* Data Points: Approximately (9k, 80%), (10k, 60%), (11k, 20%), (12k, 40%), (13k, 30%)
**Problem 26:**
* Trend: Accuracy decreases from approximately 100% at 14k tokens to 80% at 20k tokens.
* Data Points: Approximately (14k, 100%), (16k, 90%), (18k, 90%), (20k, 80%)
**Problem 27:**
* Trend: Accuracy remains high (100%) across all token counts.
* Data Points: Approximately (20k, 100%), (22k, 100%), (24k, 100%), (26k, 100%)
**Problem 28:**
* Trend: Accuracy remains high (100%) across all token counts.
* Data Points: Approximately (12k, 100%), (14k, 100%)
**Problem 29:**
* Trend: Accuracy increases from approximately 0% at 16k tokens to 100% at 18k tokens, then decreases to 20% at 32k tokens.
* Data Points: Approximately (16k, 0%), (17k, 80%), (18k, 100%), (20k, 90%), (22k, 80%), (24k, 70%), (26k, 60%), (28k, 50%), (30k, 40%), (32k, 20%)
**Problem 30:**
* Trend: Accuracy decreases from approximately 90% at 12k tokens to 40% at 22k tokens.
* Data Points: Approximately (12k, 90%), (15k, 80%), (17k, 70%), (20k, 50%), (22k, 40%)
### Key Observations
* For some problems (e.g., 4, 6, 15, 16, 18), the accuracy remains consistently low regardless of the number of tokens used.
* For other problems (e.g., 10, 12, 22, 24, 27, 28), the accuracy remains consistently high regardless of the number of tokens used.
* Some problems show a clear trend of increasing accuracy with more tokens (e.g., 14, 17, 23, 29).
* Other problems show a trend of decreasing accuracy with more tokens (e.g., 21, 26, 30).
* Some problems show a more complex relationship between accuracy and token count, with accuracy fluctuating (e.g., 8, 13, 20, 25).
### Interpretation
The charts suggest that the relationship between the length of thoughts (measured by the number of tokens) and the accuracy of the AIME-24 solver varies significantly from problem to problem.
* For some problems, increasing the length of thoughts consistently improves accuracy, suggesting that more detailed reasoning is beneficial.
* For other problems, increasing the length of thoughts has little to no impact on accuracy, suggesting that the problem may be inherently difficult or that the solver is unable to effectively utilize the additional information.
* In some cases, increasing the length of thoughts may even decrease accuracy, suggesting that the solver may be getting confused or distracted by irrelevant information.
The variability in these relationships highlights the complexity of the AIME-24 problems and the challenges of developing a general-purpose solver that can effectively handle different types of reasoning tasks. The pink shading does not appear to correlate with any specific trend or data point. It seems to be a visual element to separate the data.
DECODING INTELLIGENCE...
EXPERT: nemotron-free VERSION 1
RUNTIME: free/nvidia/nemotron-nano-12b-v2-vl:free
INTEL_VERIFIED
## Line Graphs: AlIME-24 Accuracy vs. binned Length of Thoughts
### Overview
The image displays a 5x6 grid of 30 line graphs, each labeled "Problem 1" to "Problem 30". Each graph plots "Accuracy (%)" (y-axis) against "Number of Tokens" (x-axis). The title "AlIME-24 Accuracy vs. binned Length of Thoughts" indicates the relationship between token length and model performance. Blue lines represent data points, with shaded pink regions possibly indicating confidence intervals or variability.
### Components/Axes
- **X-axis**: "Number of Tokens" (ranges from ~6 to 32 tokens per subplot).
- **Y-axis**: "Accuracy (%)" (ranges from 0% to 100%).
- **Legend**: Located in the top-right corner, labeled "AlIME-24" with a blue color.
- **Subplot Titles**: Each graph is labeled "Problem X" (X = 1–30).
### Detailed Analysis
Each subplot shows distinct trends:
- **Problem 1**: Flat line at ~80% accuracy across 6–9 tokens.
- **Problem 2**: Peaks at ~90% at 16 tokens, then drops to ~80% at 24 tokens.
- **Problem 3**: Starts at ~60%, rises to ~80% at 12 tokens, then drops to ~60% at 16 tokens.
- **Problem 4**: Flat line at 0% accuracy across all tokens.
- **Problem 5**: Peaks at ~90% at 20 tokens, then drops to ~60% at 24 tokens.
- **Problem 6**: Flat line at 0% accuracy across all tokens.
- **Problem 7**: Peaks at ~90% at 16 tokens, then drops to ~60% at 24 tokens.
- **Problem 8**: Starts at ~80%, drops to ~40% at 12 tokens, then rises to ~80% at 16 tokens.
- **Problem 9**: Peaks at ~90% at 10 tokens, then drops to ~60% at 12 tokens.
- **Problem 10**: Flat line at ~80% accuracy across 8–12 tokens.
- **Problem 11**: Starts at ~80%, drops to ~60% at 10 tokens, then stabilizes at ~60%.
- **Problem 12**: Flat line at ~80% accuracy across 10–12 tokens.
- **Problem 13**: Starts at ~40%, rises to ~80% at 12 tokens, then drops to ~60% at 16 tokens.
- **Problem 14**: Peaks at ~90% at 24 tokens, then drops to ~60% at 28 tokens.
- **Problem 15**: Starts at ~40%, peaks at ~80% at 12 tokens, then drops to ~40% at 16 tokens.
- **Problem 16**: Starts at ~20%, rises to ~60% at 24 tokens, then drops to ~40% at 28 tokens.
- **Problem 17**: Starts at ~40%, rises to ~80% at 24 tokens, then drops to ~60% at 28 tokens.
- **Problem 18**: Flat line at 0% accuracy across all tokens.
- **Problem 19**: Starts at ~80%, drops to ~60% at 16 tokens, then rises to ~80% at 24 tokens.
- **Problem 20**: Starts at ~40%, peaks at ~80% at 12 tokens, then drops to ~40% at 16 tokens.
- **Problem 21**: Flat line at ~80% accuracy across 24–28 tokens.
- **Problem 22**: Flat line at ~80% accuracy across 16–24 tokens.
- **Problem 23**: Starts at ~80%, drops to ~60% at 16 tokens, then rises to ~80% at 24 tokens.
- **Problem 24**: Flat line at ~80% accuracy across 16–24 tokens.
- **Problem 25**: Starts at ~40%, peaks at ~80% at 10 tokens, then drops to ~60% at 12 tokens.
- **Problem 26**: Flat line at ~80% accuracy across 24–28 tokens.
- **Problem 27**: Starts at ~80%, drops to ~60% at 16 tokens, then stabilizes at ~60%.
- **Problem 28**: Flat line at ~80% accuracy across 16–24 tokens.
- **Problem 29**: Starts at ~80%, drops to ~60% at 16 tokens, then rises to ~80% at 24 tokens.
- **Problem 30**: Starts at ~40%, peaks at ~80% at 12 tokens, then drops to ~40% at 16 tokens.
### Key Observations
1. **Outliers**: Problems 4, 6, and 18 show 0% accuracy, suggesting critical failures or edge cases.
2. **Stable Performance**: Problems 1, 10, 12, 21, 22, 24, 26, and 28 maintain ~80% accuracy across token ranges.
3. **Peaks and Drops**: Many problems (e.g., 2, 5, 7, 9, 14, 17, 19, 23, 25, 29, 30) show sharp accuracy peaks at specific token counts, followed by declines.
4. **Variability**: Shaded pink regions (likely confidence intervals) are present in some subplots, indicating uncertainty in measurements.
### Interpretation
The data suggests that AlIME-24's accuracy is highly sensitive to the number of tokens in certain problems. For example:
- **Optimal Token Length**: Problems like 2, 5, and 14 achieve peak accuracy at 16–24 tokens, implying that longer thoughts (within a range) improve performance.
- **Token Sensitivity**: Problems with flat lines (e.g., 1, 10, 12) may be less dependent on token length, while others (e.g., 4, 6, 18) fail entirely, highlighting potential limitations in model design or data quality.
- **Confidence Intervals**: The shaded regions suggest variability in accuracy measurements, though their exact meaning (e.g., standard deviation, prediction intervals) is not specified.
The results underscore the importance of token length in model performance, with some problems benefiting from longer thoughts and others being inherently unstable. Further analysis of the shaded regions and problem-specific contexts could clarify the underlying causes of these trends.
DECODING INTELLIGENCE...