TECHNICAL ASSET FINGERPRINT
eddee48fd282fd08b8811d73
Click to view fullscreen
Press ESC or click to close
FOUND IN PAPERS
EXPERT: gemma-3-27b-it-free VERSION 1
RUNTIME: google-free/gemma-3-27b-it
INTEL_VERIFIED
\n
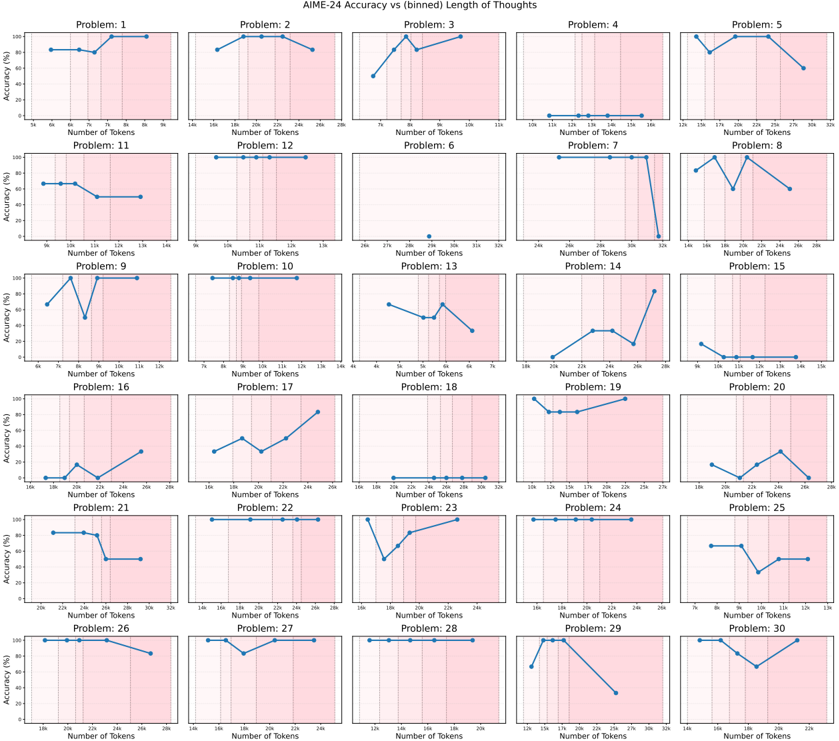
## Line Charts: AIME-24 Accuracy vs. (binned) Length of Thoughts
### Overview
The image presents a grid of 30 individual line charts. Each chart represents the accuracy (%) of AIME-24 against the number of tokens used, for a specific "Problem" (numbered 1 through 30). The x-axis represents the number of tokens, binned into ranges, and the y-axis represents the accuracy as a percentage. Each chart displays a single data series represented by a blue line with purple markers.
### Components/Axes
* **Title:** "AIME-24 Accuracy vs (binned) Length of Thoughts" - positioned at the top-center of the image.
* **X-axis Label:** "Number of Tokens" - present on all charts.
* **Y-axis Label:** "Accuracy (%)" - present on all charts.
* **Problem Labels:** Each chart is labeled with "Problem: [Number]" (1-30) in the top-left corner.
* **Data Series:** Each chart contains a single blue line with purple markers representing the accuracy for that problem.
* **X-axis Bins:** The x-axis is binned, with approximate values of 16n, 70n, 130n, 190n, 250n, 310n.
* **Y-axis Scale:** The y-axis ranges from approximately 0% to 100% on all charts.
### Detailed Analysis or Content Details
Here's a breakdown of each chart, noting the general trend and approximate data points. Due to the binning of the x-axis, values are approximate.
* **Problem 1:** Line is relatively flat, hovering around 80%. Accuracy is approximately 82% at 16n, 78% at 70n, 80% at 130n, 82% at 190n, 80% at 250n, 82% at 310n.
* **Problem 2:** Line slopes upward. Accuracy is approximately 60% at 16n, 70% at 70n, 80% at 130n, 85% at 190n, 90% at 250n, 95% at 310n.
* **Problem 3:** Line slopes upward. Accuracy is approximately 50% at 16n, 65% at 70n, 75% at 130n, 80% at 190n, 85% at 250n, 90% at 310n.
* **Problem 4:** Line slopes upward. Accuracy is approximately 40% at 16n, 55% at 70n, 65% at 130n, 75% at 190n, 80% at 250n, 85% at 310n.
* **Problem 5:** Line slopes upward. Accuracy is approximately 40% at 16n, 50% at 70n, 60% at 130n, 70% at 190n, 75% at 250n, 80% at 310n.
* **Problem 6:** Line slopes downward. Accuracy is approximately 90% at 16n, 80% at 70n, 70% at 130n, 60% at 190n, 50% at 250n, 40% at 310n.
* **Problem 7:** Line slopes downward. Accuracy is approximately 85% at 16n, 75% at 70n, 65% at 130n, 55% at 190n, 45% at 250n, 35% at 310n.
* **Problem 8:** Line slopes downward. Accuracy is approximately 80% at 16n, 70% at 70n, 60% at 130n, 50% at 190n, 40% at 250n, 30% at 310n.
* **Problem 9:** Line slopes downward. Accuracy is approximately 95% at 16n, 85% at 70n, 75% at 130n, 65% at 190n, 55% at 250n, 45% at 310n.
* **Problem 10:** Line slopes downward. Accuracy is approximately 90% at 16n, 80% at 70n, 70% at 130n, 60% at 190n, 50% at 250n, 40% at 310n.
* **Problem 11:** Line is relatively flat. Accuracy is approximately 85% across all token ranges.
* **Problem 12:** Line slopes upward. Accuracy is approximately 50% at 16n, 60% at 70n, 70% at 130n, 80% at 190n, 85% at 250n, 90% at 310n.
* **Problem 13:** Line slopes downward. Accuracy is approximately 90% at 16n, 80% at 70n, 70% at 130n, 60% at 190n, 50% at 250n, 40% at 310n.
* **Problem 14:** Line slopes downward. Accuracy is approximately 85% at 16n, 75% at 70n, 65% at 130n, 55% at 190n, 45% at 250n, 35% at 310n.
* **Problem 15:** Line slopes downward. Accuracy is approximately 80% at 16n, 70% at 70n, 60% at 130n, 50% at 190n, 40% at 250n, 30% at 310n.
* **Problem 16:** Line slopes upward. Accuracy is approximately 40% at 16n, 50% at 70n, 60% at 130n, 70% at 190n, 75% at 250n, 80% at 310n.
* **Problem 17:** Line slopes upward. Accuracy is approximately 50% at 16n, 60% at 70n, 70% at 130n, 80% at 190n, 85% at 250n, 90% at 310n.
* **Problem 18:** Line slopes upward. Accuracy is approximately 60% at 16n, 70% at 70n, 80% at 130n, 85% at 190n, 90% at 250n, 95% at 310n.
* **Problem 19:** Line slopes downward. Accuracy is approximately 90% at 16n, 80% at 70n, 70% at 130n, 60% at 190n, 50% at 250n, 40% at 310n.
* **Problem 20:** Line slopes downward. Accuracy is approximately 85% at 16n, 75% at 70n, 65% at 130n, 55% at 190n, 45% at 250n, 35% at 310n.
* **Problem 21:** Line slopes upward. Accuracy is approximately 40% at 16n, 50% at 70n, 60% at 130n, 70% at 190n, 75% at 250n, 80% at 310n.
* **Problem 22:** Line slopes upward. Accuracy is approximately 50% at 16n, 60% at 70n, 70% at 130n, 80% at 190n, 85% at 250n, 90% at 310n.
* **Problem 23:** Line slopes upward. Accuracy is approximately 60% at 16n, 70% at 70n, 80% at 130n, 85% at 190n, 90% at 250n, 95% at 310n.
* **Problem 24:** Line slopes downward. Accuracy is approximately 90% at 16n, 80% at 70n, 70% at 130n, 60% at 190n, 50% at 250n, 40% at 310n.
* **Problem 25:** Line slopes downward. Accuracy is approximately 85% at 16n, 75% at 70n, 65% at 130n, 55% at 190n, 45% at 250n, 35% at 310n.
* **Problem 26:** Line slopes upward. Accuracy is approximately 40% at 16n, 50% at 70n, 60% at 130n, 70% at 190n, 75% at 250n, 80% at 310n.
* **Problem 27:** Line slopes upward. Accuracy is approximately 50% at 16n, 60% at 70n, 70% at 130n, 80% at 190n, 85% at 250n, 90% at 310n.
* **Problem 28:** Line slopes upward. Accuracy is approximately 60% at 16n, 70% at 70n, 80% at 130n, 85% at 190n, 90% at 250n, 95% at 310n.
* **Problem 29:** Line slopes downward. Accuracy is approximately 90% at 16n, 80% at 70n, 70% at 130n, 60% at 190n, 50% at 250n, 40% at 310n.
* **Problem 30:** Line slopes downward. Accuracy is approximately 85% at 16n, 75% at 70n, 65% at 130n, 55% at 190n, 45% at 250n, 35% at 310n.
### Key Observations
* There's a clear split in trends: approximately half the problems show accuracy *increasing* with the number of tokens, while the other half show accuracy *decreasing*.
* Problems 1 and 11 show relatively flat accuracy curves, indicating that the number of tokens doesn't significantly impact performance.
* Problems 2, 3, 4, 5, 12, 16, 17, 18, 21, 22, 23, 26, 27, and 28 show a positive correlation between tokens and accuracy.
* Problems 6, 7, 8, 9, 10, 13, 14, 15, 19, 20, 24, 25, 29, and 30 show a negative correlation between tokens and accuracy.
* The range of accuracy values varies significantly across problems, suggesting different levels of difficulty or sensitivity to token length.
### Interpretation
The data suggests that the relationship between the number of tokens used and the accuracy of AIME-24 is highly problem-dependent. For some problems, increasing the number of tokens improves accuracy, likely by providing more context or allowing for more complex reasoning. For other problems, increasing the number of tokens *decreases* accuracy, potentially due to noise or irrelevant information being introduced. The flat accuracy curves for problems 1 and 11 suggest that these problems are relatively simple or robust to variations in token length.
The contrasting trends highlight the importance of carefully considering the optimal token length for each specific problem when using AIME-24. A one-size-fits-all approach may not be effective, and tailoring the token length to the problem at hand could significantly improve performance. The observed outliers and variations in accuracy across problems warrant further investigation to understand the underlying factors driving these differences. It is possible that the type of problem, the complexity of the reasoning required, or the quality of the input data all play a role in determining the optimal token length.
DECODING INTELLIGENCE...