TECHNICAL ASSET FINGERPRINT
eddee48fd282fd08b8811d73
Click to view fullscreen
Press ESC or click to close
FOUND IN PAPERS
EXPERT: healer-alpha-free VERSION 1
RUNTIME: free/openrouter/healer-alpha
INTEL_VERIFIED
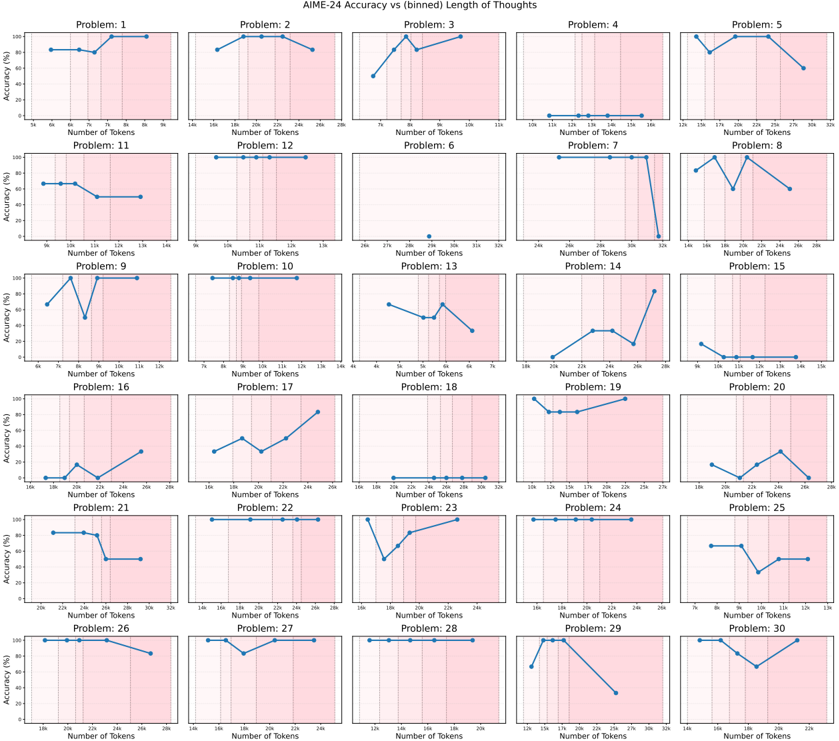
## Line Chart Grid: AIME-24 Accuracy vs (binned) Length of Thoughts
### Overview
The image is a grid of 30 individual line charts arranged in 6 rows and 5 columns. The overall title is "AIME-24 Accuracy vs (binned) Length of Thoughts". Each subplot charts the relationship between model accuracy (as a percentage) and the number of tokens used in its reasoning ("thoughts") for a specific problem, labeled "Problem: 1" through "Problem: 30". The charts collectively analyze how performance varies with the length of the model's internal reasoning process across different problems.
### Components/Axes
* **Overall Layout:** A 6x5 grid of subplots.
* **Subplot Titles:** Each subplot is titled with "Problem: [Number]", where the number ranges from 1 to 30. The numbering order is row-major (left to right, top to bottom).
* **Y-Axis (All Subplots):** Labeled "Accuracy (%)". The scale is consistently from 0 to 100, with major tick marks at 0, 20, 40, 60, 80, and 100.
* **X-Axis (All Subplots):** Labeled "Number of Tokens". The scale and range vary significantly between problems, indicating different binning or ranges of thought lengths for each problem.
* **Data Series:** A single blue line with circular markers in each subplot, representing the accuracy at different token count bins.
* **Visual Highlight:** A pink/red shaded vertical region appears on the right side of each subplot's plotting area. Its left boundary varies per chart, likely indicating a threshold or region of interest for longer thought lengths.
### Detailed Analysis
Below is a problem-by-problem breakdown. For each, the approximate x-axis range and the trend of the blue accuracy line are described. Values are approximate based on visual inspection.
**Row 1:**
* **Problem 1:** X-axis: ~55 to 85 tokens. Trend: Starts high (~90%), slight dip, then rises to near 100%.
* **Problem 2:** X-axis: ~140 to 240 tokens. Trend: Starts ~80%, rises to ~95%, then declines slightly.
* **Problem 3:** X-axis: ~70 to 115 tokens. Trend: Starts low (~40%), sharp rise to ~95%, then slight decline.
* **Problem 4:** X-axis: ~100 to 180 tokens. Trend: Flat line at 0% accuracy across all bins.
* **Problem 5:** X-axis: ~125 to 200 tokens. Trend: Starts high (~95%), plateaus, then declines to ~60%.
**Row 2:**
* **Problem 11:** X-axis: ~90 to 140 tokens. Trend: Starts ~70%, slight rise, then declines to ~50%.
* **Problem 12:** X-axis: ~100 to 150 tokens. Trend: Flat line at 100% accuracy.
* **Problem 6:** X-axis: ~240 to 320 tokens. Trend: Single data point at 0% accuracy.
* **Problem 7:** X-axis: ~240 to 320 tokens. Trend: Flat line at 100% accuracy, then a sharp drop to 0% at the final bin.
* **Problem 8:** X-axis: ~140 to 200 tokens. Trend: Fluctuates between ~60% and ~90%.
**Row 3:**
* **Problem 9:** X-axis: ~40 to 125 tokens. Trend: Highly volatile, swinging between ~20% and 100%.
* **Problem 10:** X-axis: ~70 to 140 tokens. Trend: Flat line at 100% accuracy.
* **Problem 13:** X-axis: ~40 to 75 tokens. Trend: Starts ~70%, declines, then a small rise before falling to ~20%.
* **Problem 14:** X-axis: ~190 to 280 tokens. Trend: Starts near 0%, rises in steps to ~90%.
* **Problem 15:** X-axis: ~90 to 150 tokens. Trend: Starts low (~10%), declines to 0% and stays flat.
**Row 4:**
* **Problem 16:** X-axis: ~160 to 200 tokens. Trend: Starts at 0%, small bump, then rises to ~30%.
* **Problem 17:** X-axis: ~100 to 160 tokens. Trend: Fluctuates between ~30% and ~50%, then rises sharply to ~80%.
* **Problem 18:** X-axis: ~180 to 320 tokens. Trend: Flat line at 0% accuracy.
* **Problem 19:** X-axis: ~190 to 270 tokens. Trend: Starts high (~95%), slight decline, then rises back to near 100%.
* **Problem 20:** X-axis: ~180 to 240 tokens. Trend: Fluctuates between ~10% and ~40%.
**Row 5:**
* **Problem 21:** X-axis: ~200 to 320 tokens. Trend: Starts ~80%, declines to ~40% and plateaus.
* **Problem 22:** X-axis: ~130 to 260 tokens. Trend: Flat line at 100% accuracy.
* **Problem 23:** X-axis: ~130 to 240 tokens. Trend: Starts high (~95%), sharp drop to ~30%, then recovers to ~90%.
* **Problem 24:** X-axis: ~200 to 260 tokens. Trend: Flat line at 100% accuracy.
* **Problem 25:** X-axis: ~70 to 130 tokens. Trend: Starts ~60%, declines to ~20%, then recovers to ~50%.
**Row 6:**
* **Problem 26:** X-axis: ~190 to 240 tokens. Trend: Starts at 100%, declines slightly to ~80%.
* **Problem 27:** X-axis: ~160 to 240 tokens. Trend: Starts at 100%, dips to ~80%, then returns to 100%.
* **Problem 28:** X-axis: ~120 to 200 tokens. Trend: Flat line at 100% accuracy.
* **Problem 29:** X-axis: ~130 to 200 tokens. Trend: Starts ~60%, rises to 100%, then declines sharply to ~20%.
* **Problem 30:** X-axis: ~140 to 200 tokens. Trend: Starts at 100%, declines to ~60%, then recovers to 100%.
### Key Observations
1. **High Variance in Performance:** Accuracy varies dramatically between problems, from consistently 100% (e.g., Problems 10, 12, 22, 24, 28) to consistently 0% (Problems 4, 18).
2. **Non-Linear Relationship:** For many problems, accuracy does not have a simple linear relationship with thought length. Trends include:
* **Inverted U-shape:** Performance peaks at a medium length (e.g., Problem 2).
* **U-shape:** Performance is poor at short and long lengths but better in the middle (e.g., Problem 23).
* **Monotonic Increase:** Accuracy improves with longer thoughts (e.g., Problem 14).
* **Monotonic Decrease:** Accuracy worsens with longer thoughts (e.g., Problem 5, 21).
* **Plateau:** Accuracy is stable across measured lengths (e.g., Problems 10, 12, 28).
3. **Pink Shaded Region:** This region, starting at a problem-specific token count, consistently covers the rightmost portion of each chart. It may denote a "long thought" regime where performance often declines or becomes unstable (e.g., Problems 5, 7, 21, 29).
4. **Data Sparsity:** Some charts have very few data points (e.g., Problem 6 has one), suggesting limited samples for those thought-length bins.
### Interpretation
This grid of charts provides a granular, problem-specific analysis of the "AIME-24" model's performance. The core insight is that **the optimal length for a model's reasoning chain is highly problem-dependent.** There is no universal rule that "longer thoughts are better" or "shorter thoughts are better."
* **Problem Difficulty & Strategy:** Problems with flat 100% accuracy (10, 12, 22, 24, 28) may be straightforward for the model, solvable with minimal reasoning. Problems with 0% accuracy (4, 18) may be fundamentally beyond the model's capability or require a reasoning approach it cannot access.
* **The "Sweet Spot" Phenomenon:** The common inverted U-shape (e.g., Problem 2) suggests many problems have an optimal reasoning length. Too few tokens may indicate insufficient deliberation, while too many may lead to overthinking, error accumulation, or distraction.
* **Pathology of Long Thoughts:** The pink region and the frequent performance drop within it (e.g., Problem 7's cliff, Problem 29's decline) highlight a potential failure mode. Extended reasoning chains may become incoherent or off-track for certain problem types.
* **Diagnostic Value:** This visualization is a powerful diagnostic tool. Instead of a single aggregate accuracy score, it reveals *how* and *when* the model fails. For instance, Problem 9's volatility suggests unstable reasoning, while Problem 14's steady climb indicates a problem where more computation directly translates to better solutions.
In summary, the data argues for a nuanced view of AI reasoning. Maximizing performance likely requires not just making models that can think longer, but understanding *which problems benefit from longer thought* and developing methods to guide the reasoning process toward the problem-specific "sweet spot" while avoiding the pathologies of excessively long chains.
DECODING INTELLIGENCE...