\n
## Line Chart: Cost per Sequence vs. Sequence Number
### Overview
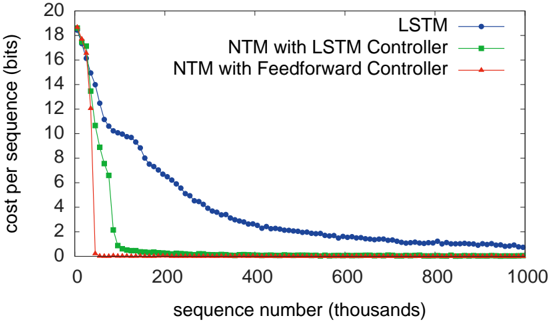
This image presents a line chart illustrating the cost per sequence (in bits) as a function of the sequence number (in thousands). Three different models are compared: LSTM, NTM with LSTM Controller, and NTM with Feedforward Controller. The chart demonstrates how the cost per sequence changes as the model processes more sequences.
### Components/Axes
* **X-axis:** Sequence number (thousands). Scale ranges from 0 to 1000.
* **Y-axis:** Cost per sequence (bits). Scale ranges from 0 to 20.
* **Legend:** Located at the top-right corner of the chart.
* LSTM (Blue line)
* NTM with LSTM Controller (Green line)
* NTM with Feedforward Controller (Red line)
### Detailed Analysis
* **LSTM (Blue Line):** The line starts at approximately 18 bits at sequence number 0, and exhibits a steep downward slope initially. The cost per sequence decreases rapidly until around sequence number 200, where the slope becomes less steep. The line continues to decrease, approaching approximately 1 bit at sequence number 1000.
* Sequence 0: ~18 bits
* Sequence 100: ~10 bits
* Sequence 200: ~4 bits
* Sequence 400: ~2.5 bits
* Sequence 600: ~1.7 bits
* Sequence 800: ~1.3 bits
* Sequence 1000: ~1 bit
* **NTM with LSTM Controller (Green Line):** The line begins at approximately 17 bits at sequence number 0, and decreases rapidly to nearly 0 bits within the first 100 sequence numbers. It remains relatively flat at around 0 bits for the remainder of the sequence numbers.
* Sequence 0: ~17 bits
* Sequence 50: ~1 bit
* Sequence 100: ~0.2 bits
* Sequence 200: ~0.1 bits
* Sequence 400: ~0.1 bits
* Sequence 600: ~0.1 bits
* Sequence 800: ~0.1 bits
* Sequence 1000: ~0.1 bits
* **NTM with Feedforward Controller (Red Line):** The line starts at approximately 18 bits at sequence number 0, and decreases rapidly to nearly 0 bits within the first 50 sequence numbers. It remains relatively flat at around 0 bits for the remainder of the sequence numbers.
* Sequence 0: ~18 bits
* Sequence 25: ~1 bit
* Sequence 50: ~0.1 bits
* Sequence 100: ~0.1 bits
* Sequence 200: ~0.1 bits
* Sequence 400: ~0.1 bits
* Sequence 600: ~0.1 bits
* Sequence 800: ~0.1 bits
* Sequence 1000: ~0.1 bits
### Key Observations
* The LSTM model exhibits a continuous decrease in cost per sequence, but never reaches the low values achieved by the NTM models.
* Both NTM models (LSTM and Feedforward Controller) converge to a very low cost per sequence much faster than the LSTM model.
* The NTM with Feedforward Controller and NTM with LSTM Controller perform similarly, reaching near-zero cost per sequence very quickly.
* The initial drop in cost per sequence is most pronounced for the NTM models.
### Interpretation
The data suggests that the NTM models, particularly those with either LSTM or Feedforward controllers, are significantly more efficient at learning and processing sequences compared to the standard LSTM model. The rapid convergence to a low cost per sequence indicates that the NTM models are able to effectively utilize their memory mechanisms to store and retrieve information, leading to improved performance. The LSTM model, while still improving with more sequences, does not achieve the same level of efficiency. The similarity in performance between the two NTM models suggests that the choice of controller (LSTM vs. Feedforward) has a minimal impact on the overall cost per sequence in this scenario. The chart demonstrates the benefits of incorporating neural Turing machine (NTM) architectures for sequence learning tasks. The initial high cost likely represents the model's initial uncertainty and the need to learn the underlying patterns in the data. As the model processes more sequences, it refines its understanding and reduces the cost per sequence.