## Chart: Optimal Error vs. Alpha with MNIST and Synthetic Data
### Overview
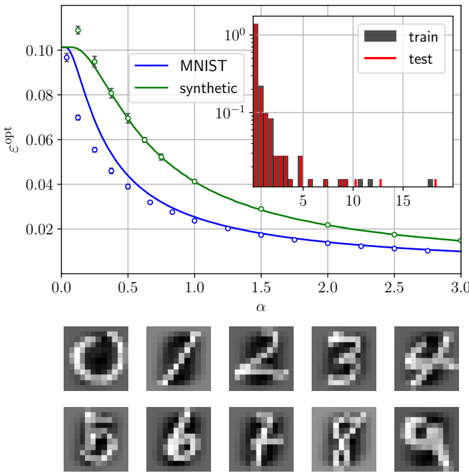
The image presents a line chart comparing the optimal error (ε<sub>opt</sub>) for two datasets – MNIST and synthetic – as a function of the alpha (α) parameter. A histogram showing the distribution of a value (likely related to training) is included as an inset. Below the chart, a grid of grayscale images representing handwritten digits is displayed.
### Components/Axes
* **X-axis:** α (Alpha), ranging from 0.0 to 3.0, with tick marks at 0.0, 0.5, 1.0, 1.5, 2.0, 2.5, and 3.0.
* **Y-axis:** ε<sub>opt</sub> (Optimal Error), ranging from approximately 0.0 to 0.11, displayed on a linear scale.
* **Lines:**
* Blue Line: Represents the MNIST dataset.
* Green Line: Represents the synthetic dataset.
* **Markers:** Blue circles mark data points for the MNIST dataset. Green crosses mark data points for the synthetic dataset.
* **Inset Histogram:**
* X-axis: Unlabeled, ranging from approximately 0 to 15.
* Y-axis: Logarithmic scale, ranging from 10<sup>-1</sup> to 10<sup>0</sup>.
* Bars: Red bars represent the "train" data, and black bars represent the "test" data.
* **Legend:** Located in the top-right corner, labeling the lines and histogram bars.
* **Image Grid:** A 2x5 grid of grayscale images of handwritten digits.
### Detailed Analysis
**Line Chart Analysis:**
* **MNIST (Blue Line):** The line slopes downward, indicating that as α increases, the optimal error decreases.
* At α = 0.0, ε<sub>opt</sub> ≈ 0.10.
* At α = 0.5, ε<sub>opt</sub> ≈ 0.08.
* At α = 1.0, ε<sub>opt</sub> ≈ 0.06.
* At α = 1.5, ε<sub>opt</sub> ≈ 0.04.
* At α = 2.0, ε<sub>opt</sub> ≈ 0.025.
* At α = 2.5, ε<sub>opt</sub> ≈ 0.018.
* At α = 3.0, ε<sub>opt</sub> ≈ 0.015.
* **Synthetic (Green Line):** The line also slopes downward, but the decrease in optimal error is less pronounced than for the MNIST dataset.
* At α = 0.0, ε<sub>opt</sub> ≈ 0.10.
* At α = 0.5, ε<sub>opt</sub> ≈ 0.07.
* At α = 1.0, ε<sub>opt</sub> ≈ 0.05.
* At α = 1.5, ε<sub>opt</sub> ≈ 0.035.
* At α = 2.0, ε<sub>opt</sub> ≈ 0.025.
* At α = 2.5, ε<sub>opt</sub> ≈ 0.02.
* At α = 3.0, ε<sub>opt</sub> ≈ 0.018.
**Inset Histogram Analysis:**
* The histogram shows the distribution of a value for both the "train" (red) and "test" (black) datasets.
* The "train" data has a higher frequency around a value of approximately 2-3.
* The "test" data has a higher frequency around a value of approximately 5-6.
* The distribution appears to be skewed to the right for both datasets.
**Image Grid Analysis:**
* The grid displays grayscale images of handwritten digits, likely examples from the MNIST dataset.
* The digits visible are: 0, 7, 2, 3, 4, 5, 6, 7, 4, 9.
### Key Observations
* Increasing α consistently reduces the optimal error for both datasets.
* The MNIST dataset exhibits a more significant reduction in optimal error with increasing α compared to the synthetic dataset.
* The histogram suggests a difference in the distribution of a value between the training and testing datasets.
* The image grid provides visual examples of the data used in the analysis.
### Interpretation
The chart demonstrates the relationship between the α parameter and the optimal error for both MNIST and synthetic datasets. The decreasing trend in optimal error with increasing α suggests that the parameter plays a role in improving the performance of a model trained on these datasets. The more substantial reduction in error for MNIST indicates that the parameter may be more effective for real-world data compared to synthetic data.
The inset histogram likely represents the distribution of a loss function or a similar metric during training and testing. The difference in distributions between the train and test datasets suggests potential overfitting or a discrepancy between the training and testing environments.
The image grid provides context by showing examples of the handwritten digits used in the MNIST dataset. This helps to understand the nature of the data being analyzed and the challenges associated with digit recognition.
The overall analysis suggests that the α parameter is a valuable tuning parameter for models trained on these datasets, and that careful consideration should be given to the differences between real-world and synthetic data when optimizing model performance.