\n
## Mathematical Expression: Vector Analysis
### Overview
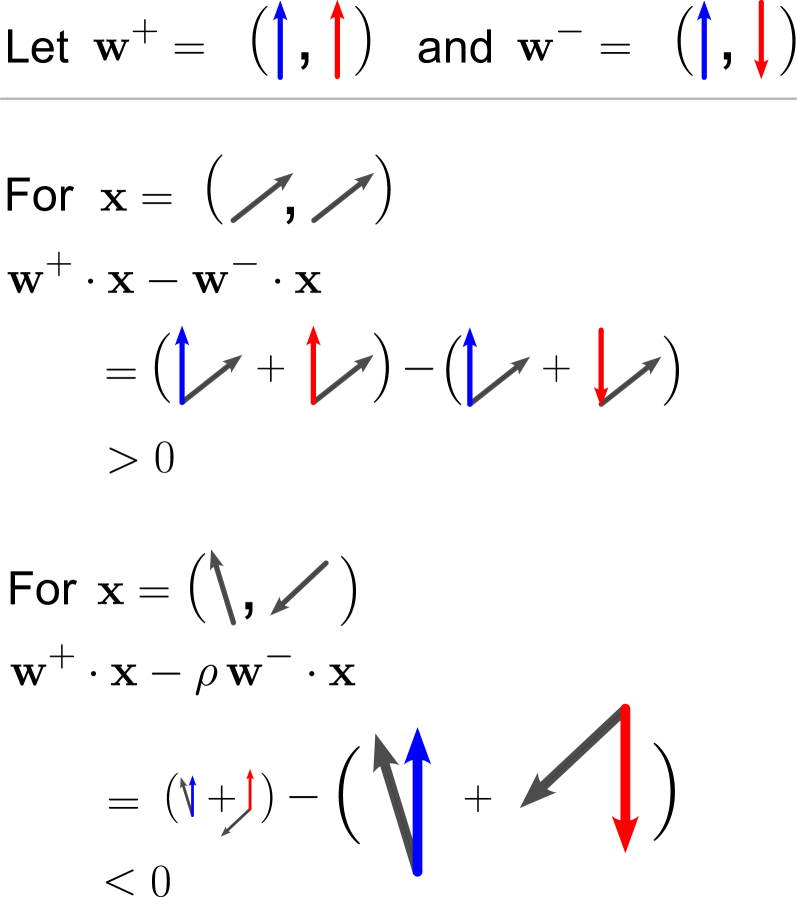
The image presents a mathematical derivation involving vector operations, specifically dot products, and inequalities. It defines two vectors, `w+` and `w-`, and then demonstrates how their dot products with different vectors `x` result in positive and negative values, respectively. The vectors are represented visually with arrows.
### Components/Axes
There are no explicit axes or scales in this image. The components are mathematical expressions and vector representations. The key elements are:
* `w+ = (↑, ↓)`: A vector defined as having an upward and downward component.
* `w- = (↑, ↓)`: A vector defined as having an upward and downward component.
* `x = (↗, ↙)`: A vector defined as having a northeast and southwest component.
* `x = (↖, ↗)`: A vector defined as having a northwest and northeast component.
* Dot product notation: `w+.x - w-.x` and `w+.x - ρw-.x`
* Inequality signs: `> 0` and `< 0`
* Vector arrows: Representing direction and potentially magnitude.
### Detailed Analysis or Content Details
The image shows two separate calculations:
**Calculation 1:**
* `w+ = (↑, ↓)` and `w- = (↑, ↓)` are defined.
* `x = (↗, ↙)` is defined.
* `w+.x - w-.x = (↗ + ↙) - (↖ + ↘)`
* The result of the dot product is `> 0`. The arrows visually represent the vector addition and subtraction. The upward-pointing red arrow and downward-pointing red arrow are added, and the upward-pointing blue arrow and downward-pointing blue arrow are subtracted.
**Calculation 2:**
* `w+ = (↑, ↓)` and `w- = (↑, ↓)` are defined.
* `x = (↖, ↗)` is defined.
* `w+.x - ρw-.x = (↖ + ↗) - (↙ + ↘)` where ρ (rho) is a scalar.
* The result of the dot product is `< 0`. The upward-pointing red arrow and downward-pointing red arrow are added, and the upward-pointing blue arrow and downward-pointing blue arrow are subtracted.
The colors used are:
* Red: Represents the `w+` vector components.
* Blue: Represents the `w-` vector components.
### Key Observations
* The vectors `w+` and `w-` are identical in both calculations.
* The vector `x` changes in each calculation, leading to different results.
* The first calculation results in a positive value, while the second results in a negative value.
* The introduction of the scalar `ρ` (rho) in the second calculation suggests a scaling factor applied to the `w-` vector.
* The visual representation of the dot product using arrows is a key element in understanding the calculations.
### Interpretation
This image demonstrates a concept in vector analysis, likely related to determining the sign of a dot product. The choice of vectors `x` and the scalar `ρ` are crucial in determining whether the result is positive or negative. The visual representation helps to understand how the components of the vectors contribute to the overall dot product.
The first calculation shows that when `x` is oriented in a way that aligns more with `w+` than `w-`, the dot product is positive. The second calculation, with a different `x` and the scaling factor `ρ`, shows that the dot product can be negative under different conditions.
This could be related to concepts like:
* **Classification:** Determining which side of a hyperplane a point lies on.
* **Support Vector Machines (SVMs):** The sign of the dot product is used to determine the margin.
* **Eigenvalue problems:** The sign of the eigenvalue can be related to the stability of a system.
The image is a concise illustration of a fundamental principle in linear algebra and its applications. The use of both mathematical notation and visual representation enhances understanding.