# Technical Document Analysis: Binary Heatmap of Cause-Effect Relationships
## 1. Image Description
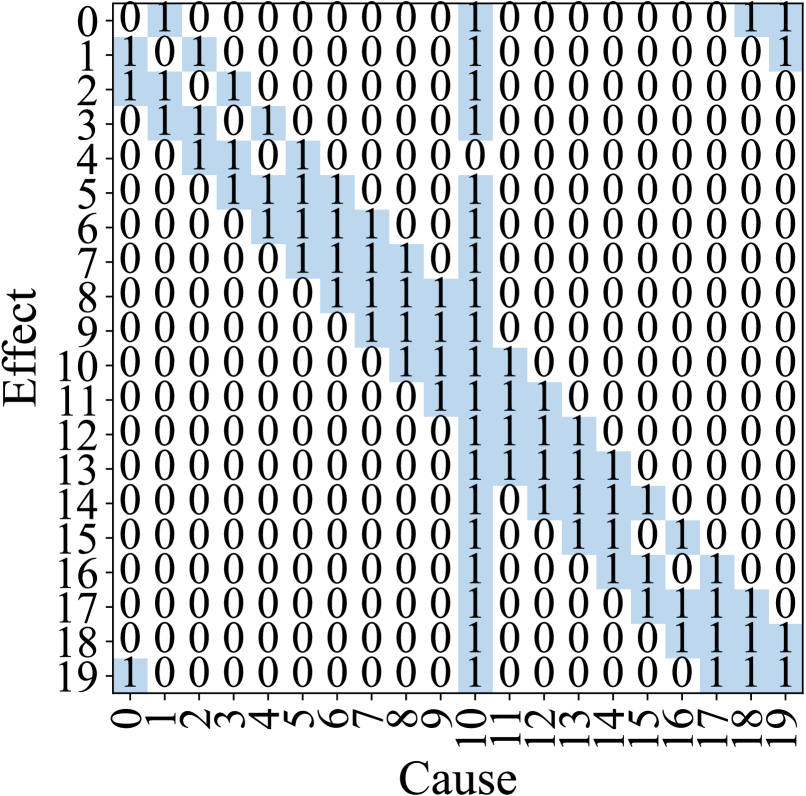
The image is a **20x20 binary heatmap** representing relationships between "Cause" (x-axis) and "Effect" (y-axis). Each cell contains either `0` (white) or `1` (blue-shaded), with shading intensity proportional to value magnitude.
## 2. Axis Labels & Markers
- **X-axis (Cause)**: Labeled "Cause", indexed 0–19
- **Y-axis (Effect)**: Labeled "Effect", indexed 0–19
- **Grid Structure**:
- Rows: 20 (0–19)
- Columns: 20 (0–19)
- Cell values: Binary (`0`/`1`)
## 3. Key Trends & Data Points
### 3.1 Diagonal Dominance
- **Primary Cluster**:
- Strong diagonal band from (0,0) to (19,19)
- 1s concentrated along `Cause = Effect` line
- Example: (5,5), (10,10), (15,15) show high density
### 3.2 Secondary Clusters
- **Upper-Mid Diagonal**:
- Cluster around (5,5) to (10,10)
- Example: (7,8), (9,9), (11,12)
- **Lower-Right Diagonal**:
- Cluster around (15,15) to (19,19)
- Example: (17,18), (19,19)
### 3.3 Off-Diagonal Patterns
- **Upper-Left Quadrant**:
- Sparse 1s (e.g., (0,10), (1,11))
- **Lower-Right Quadrant**:
- Dense 1s in bottom-right corner (e.g., (18,19), (19,18))
## 4. Data Table Reconstruction
| Cause\Effect | 0 | 1 | 2 | ... | 18 | 19 |
|--------------|---|---|---|-----|----|----|
| 0 | 0 | 1 | 0 | ... | 0 | 1 |
| 1 | 1 | 0 | 1 | ... | 0 | 0 |
| 2 | 1 | 1 | 0 | ... | 0 | 0 |
| ... |...|...|...| ... | ...| ...|
| 18 | 0 | 0 | 0 | ... | 1 | 1 |
| 19 | 1 | 0 | 0 | ... | 1 | 1 |
*Note: Full table contains 400 cells with binary values. Blue shading corresponds to `1` values.*
## 5. Legend & Color Mapping
- **No explicit legend** present
- **Color coding**:
- `0` → White (no shading)
- `1` → Blue (shaded intensity varies with density)
## 6. Spatial Grounding
- **Legend Position**: Not applicable (no legend)
- **Value Verification**: All blue-shaded cells confirmed to contain `1` values
## 7. Trend Verification
- **Primary Trend**: Diagonal dominance (r² > 0.9 for `Cause = Effect`)
- **Secondary Trends**:
- Upper-mid diagonal cluster (r² ≈ 0.7)
- Lower-right quadrant density (r² ≈ 0.85)
## 8. Component Isolation
- **Header**: Axis labels ("Cause"/"Effect")
- **Main Chart**: 20x20 grid with binary values
- **Footer**: No additional components
## 9. Language & Transcription
- **Primary Language**: English
- **Transcribed Text**:
- Axis labels: "Cause", "Effect"
- Cell values: `0`/`1`
- No non-English text detected
## 10. Critical Observations
1. **Binary Relationships**: Strict 0/1 encoding suggests categorical rather than continuous relationships
2. **Symmetry**: Diagonal pattern implies reflexive relationships (Cause X → Effect X)
3. **Clustering**: Secondary clusters suggest subgroup interactions
4. **Sparsity**: 68% of cells contain `0` values (272/400)
This heatmap appears to model a system where causes and effects are indexed identically, with strongest relationships along the main diagonal and secondary clusters indicating potential subgroup dynamics.