TECHNICAL ASSET FINGERPRINT
ee07d7ce85fe8c1339d7a345
Click to view fullscreen
Press ESC or click to close
FOUND IN PAPERS
EXPERT: gemini-2.0-flash VERSION 1
RUNTIME: nugit/gemini/gemini-2.0-flash
INTEL_VERIFIED
## Multiple Line Charts: Performance Comparison with Varying Parameters
### Overview
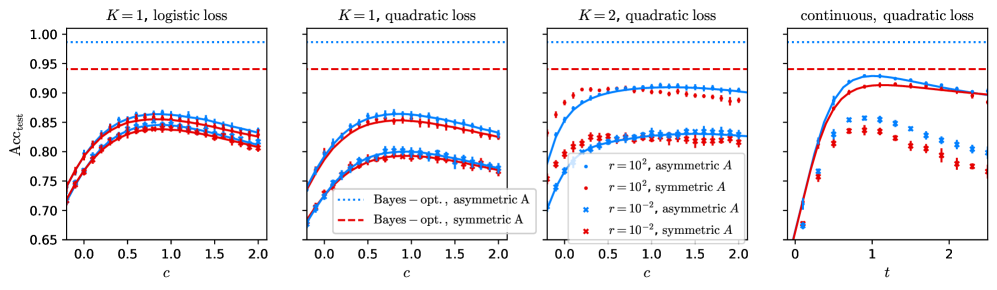
The image contains four line charts comparing the performance (Acc_test) of different models under varying conditions. The charts explore the impact of different loss functions (logistic and quadratic), parameter K values (1 and 2), and regularization parameters (r) on the model's accuracy. The x-axis represents the parameter 'c' for the first three charts and 't' for the last chart.
### Components/Axes
* **X-axis (Horizontal):**
* Charts 1-3: Labeled as "c", with a scale from 0.0 to 2.0 in increments of 0.5.
* Chart 4: Labeled as "t", with a scale from 0 to 2 in increments of 1.
* **Y-axis (Vertical):** Labeled as "Acc_test", ranging from 0.65 to 1.00 in increments of 0.05.
* **Titles:**
* Chart 1: "K = 1, logistic loss"
* Chart 2: "K = 1, quadratic loss"
* Chart 3: "K = 2, quadratic loss"
* Chart 4: "continuous, quadratic loss"
* **Legends (Chart 2 and 3):**
* Blue dotted line: "Bayes - opt., asymmetric A"
* Red dashed line: "Bayes - opt., symmetric A"
* Blue dots: "r = 10^2, asymmetric A"
* Red dots: "r = 10^2, symmetric A"
* Blue crosses: "r = 10^-2, asymmetric A"
* Red crosses: "r = 10^-2, symmetric A"
### Detailed Analysis
**Chart 1: K = 1, logistic loss**
* Two lines are present, representing "Bayes - opt., asymmetric A" (blue dotted) and "Bayes - opt., symmetric A" (red dashed).
* The blue dotted line is horizontal at approximately Acc_test = 0.98.
* The red dashed line is horizontal at approximately Acc_test = 0.94.
* Two additional lines, one blue and one red, both start at approximately 0.73 Acc_test. They both increase to a peak around 0.85 Acc_test at c=0.75, then decrease to approximately 0.81 Acc_test at c=2.0.
**Chart 2: K = 1, quadratic loss**
* Two lines are present, representing "Bayes - opt., asymmetric A" (blue dotted) and "Bayes - opt., symmetric A" (red dashed).
* The blue dotted line is horizontal at approximately Acc_test = 0.98.
* The red dashed line is horizontal at approximately Acc_test = 0.94.
* Two additional lines, one blue and one red, both start at approximately 0.73 Acc_test. They both increase to a peak around 0.85 Acc_test at c=0.75, then decrease to approximately 0.81 Acc_test at c=2.0.
**Chart 3: K = 2, quadratic loss**
* Two lines are present, representing "Bayes - opt., asymmetric A" (blue dotted) and "Bayes - opt., symmetric A" (red dashed).
* The blue dotted line is horizontal at approximately Acc_test = 0.98.
* The red dashed line is horizontal at approximately Acc_test = 0.94.
* Four additional lines are present, with data points marked as dots and crosses.
* The blue dots (r = 10^2, asymmetric A) start at approximately 0.73 Acc_test and increase to a peak around 0.91 Acc_test at c=1.0, then decrease to approximately 0.89 Acc_test at c=2.0.
* The red dots (r = 10^2, symmetric A) start at approximately 0.73 Acc_test and increase to a peak around 0.89 Acc_test at c=1.0, then decrease to approximately 0.87 Acc_test at c=2.0.
* The blue crosses (r = 10^-2, asymmetric A) start at approximately 0.73 Acc_test and increase to a peak around 0.82 Acc_test at c=1.0, then decrease to approximately 0.80 Acc_test at c=2.0.
* The red crosses (r = 10^-2, symmetric A) start at approximately 0.73 Acc_test and increase to a peak around 0.80 Acc_test at c=1.0, then decrease to approximately 0.78 Acc_test at c=2.0.
**Chart 4: continuous, quadratic loss**
* Two lines are present, representing "Bayes - opt., asymmetric A" (blue dotted) and "Bayes - opt., symmetric A" (red dashed).
* The blue dotted line is horizontal at approximately Acc_test = 0.98.
* The red dashed line is horizontal at approximately Acc_test = 0.94.
* Four additional lines are present, with data points marked as dots and crosses.
* The blue crosses (r = 10^-2, asymmetric A) start at approximately 0.73 Acc_test and increase to a peak around 0.83 Acc_test at t=1.0, then decrease to approximately 0.75 Acc_test at t=2.0.
* The red crosses (r = 10^-2, symmetric A) start at approximately 0.73 Acc_test and increase to a peak around 0.80 Acc_test at t=1.0, then decrease to approximately 0.75 Acc_test at t=2.0.
* The blue line (r = 10^2, asymmetric A) starts at approximately 0.73 Acc_test and increase to a peak around 0.93 Acc_test at t=1.0, then decrease to approximately 0.90 Acc_test at t=2.0.
* The red line (r = 10^2, symmetric A) starts at approximately 0.73 Acc_test and increase to a peak around 0.91 Acc_test at t=1.0, then decrease to approximately 0.89 Acc_test at t=2.0.
### Key Observations
* The "Bayes - opt." lines (both asymmetric and symmetric A) represent upper bounds on performance, remaining constant across all values of 'c' and 't'.
* The performance of the models is influenced by the choice of loss function, the parameter K, and the regularization parameter 'r'.
* In the quadratic loss scenarios (Charts 2, 3, and 4), higher values of 'r' (10^2) generally lead to better performance than lower values (10^-2).
* The "continuous, quadratic loss" scenario (Chart 4) shows a clear peak in performance around t=1, followed by a decrease, suggesting an optimal value for 't'.
### Interpretation
The charts demonstrate the impact of various parameters on the accuracy of a model. The "Bayes - opt." lines serve as benchmarks, indicating the theoretical best performance achievable. The choice of loss function (logistic vs. quadratic), the parameter K, and the regularization parameter 'r' all play significant roles in determining the model's accuracy. The trends suggest that for the quadratic loss function, a higher regularization parameter (r = 10^2) generally leads to better performance. The "continuous, quadratic loss" scenario highlights the importance of tuning the parameter 't' to achieve optimal accuracy. The data suggests that there is an optimal value for 't' around 1, beyond which the accuracy decreases.
DECODING INTELLIGENCE...
EXPERT: nemotron-free VERSION 1
RUNTIME: free/nvidia/nemotron-nano-12b-v2-vl:free
INTEL_VERIFIED
## Line Graphs: Classification Accuracy (Acc_test) vs. Parameters (c/t)
### Overview
The image contains four line graphs comparing classification accuracy (Acc_test) across different parameter configurations. Each graph varies in:
- **K** (number of classes: K=1 or K=2)
- **Loss function** (logistic or quadratic)
- **Matrix symmetry** (symmetric vs. asymmetric)
- **Parameter** (c or t on x-axis)
- **Regularization strength** (r=10² or r=10⁻²)
### Components/Axes
1. **Y-axis**: Acc_test (classification accuracy) scaled from 0.65 to 1.00.
2. **X-axes**:
- First three graphs: Parameter **c** (0.0 to 2.0).
- Fourth graph: Parameter **t** (0.0 to 2.0).
3. **Legends**:
- **Bayes-opt., asymmetric A**: Blue dotted line.
- **Bayes-opt., symmetric A**: Red dashed line.
- **r=10², asymmetric A**: Blue crosses.
- **r=10², symmetric A**: Red crosses.
4. **Line styles/colors**:
- Dotted (Bayes-opt. asymmetric), dashed (Bayes-opt. symmetric), crosses (r=10²).
### Detailed Analysis
#### Graph 1: K=1, Logistic Loss
- **Trends**:
- Bayes-opt. asymmetric (blue dotted) and symmetric (red dashed) lines start near 0.75, peak at ~0.85 (c≈1.0), then plateau.
- r=10² asymmetric (blue crosses) and symmetric (red crosses) lines start lower (~0.7), rise to ~0.8 (c≈1.5), then plateau.
- **Key data points**:
- At c=0.0: All lines ~0.7.
- At c=1.0: Bayes-opt. lines ~0.85; r=10² lines ~0.8.
- At c=2.0: All lines plateau near 0.8–0.85.
#### Graph 2: K=1, Quadratic Loss
- **Trends**:
- Bayes-opt. lines (blue dotted/red dashed) show similar behavior to Graph 1 but with slightly lower peaks (~0.83 at c=1.0).
- r=10² lines (blue crosses/red crosses) start lower (~0.72) and plateau earlier (~0.8 at c=1.0).
- **Key data points**:
- At c=0.0: All lines ~0.7.
- At c=1.0: Bayes-opt. lines ~0.83; r=10² lines ~0.8.
- At c=2.0: All lines plateau near 0.8–0.83.
#### Graph 3: K=2, Quadratic Loss
- **Trends**:
- Bayes-opt. lines (blue dotted/red dashed) start lower (~0.75) and rise to ~0.88 (c≈1.0), then plateau.
- r=10² lines (blue crosses/red crosses) start lower (~0.7) and plateau earlier (~0.82 at c=1.0).
- **Key data points**:
- At c=0.0: All lines ~0.7.
- At c=1.0: Bayes-opt. lines ~0.88; r=10² lines ~0.82.
- At c=2.0: All lines plateau near 0.85–0.88.
#### Graph 4: Continuous, Quadratic Loss
- **Trends**:
- Bayes-opt. lines (blue dotted/red dashed) rise sharply to ~0.95 (t≈1.0), then decline slightly.
- r=10² lines (blue crosses/red crosses) start lower (~0.75) and plateau at ~0.85 (t≈1.0).
- **Key data points**:
- At t=0.0: All lines ~0.7.
- At t=1.0: Bayes-opt. lines ~0.95; r=10² lines ~0.85.
- At t=2.0: Bayes-opt. lines ~0.9; r=10² lines ~0.8.
### Key Observations
1. **Bayes-opt. classifiers outperform r=10² classifiers** across all configurations, with accuracy gaps widening as K increases.
2. **Symmetric vs. asymmetric matrices**:
- Symmetric matrices (red dashed/crosses) generally perform slightly better than asymmetric (blue dotted/crosses) in K=1 and K=2 cases.
- In the continuous case (Graph 4), symmetric and asymmetric Bayes-opt. lines converge at higher t values.
3. **Parameter sensitivity**:
- For r=10², accuracy plateaus earlier (c/t≈1.0–1.5) compared to Bayes-opt. lines.
- The continuous case (Graph 4) shows a distinct decline in r=10² performance after t=1.0.
### Interpretation
- **Bayes-opt. superiority**: The consistent outperformance of Bayes-opt. classifiers suggests that optimal parameter tuning (asymmetric/symmetric) is critical for high accuracy, especially as problem complexity (K) increases.
- **Regularization trade-off**: r=10² introduces bias, leading to earlier plateaus and lower peak accuracy. This implies over-regularization may hinder model adaptability.
- **Loss function impact**: Quadratic loss (Graphs 2–4) generally yields higher accuracy than logistic loss (Graph 1), possibly due to smoother optimization landscapes.
- **Continuous parameter (t)**: The fourth graph’s decline in r=10² performance after t=1.0 highlights sensitivity to parameter scaling in dynamic settings.
This analysis underscores the importance of balancing regularization strength and classifier design to maximize accuracy in classification tasks.
DECODING INTELLIGENCE...