## Heatmap: Baseline - Core Generalization - Qwen-2.5 3B
### Overview
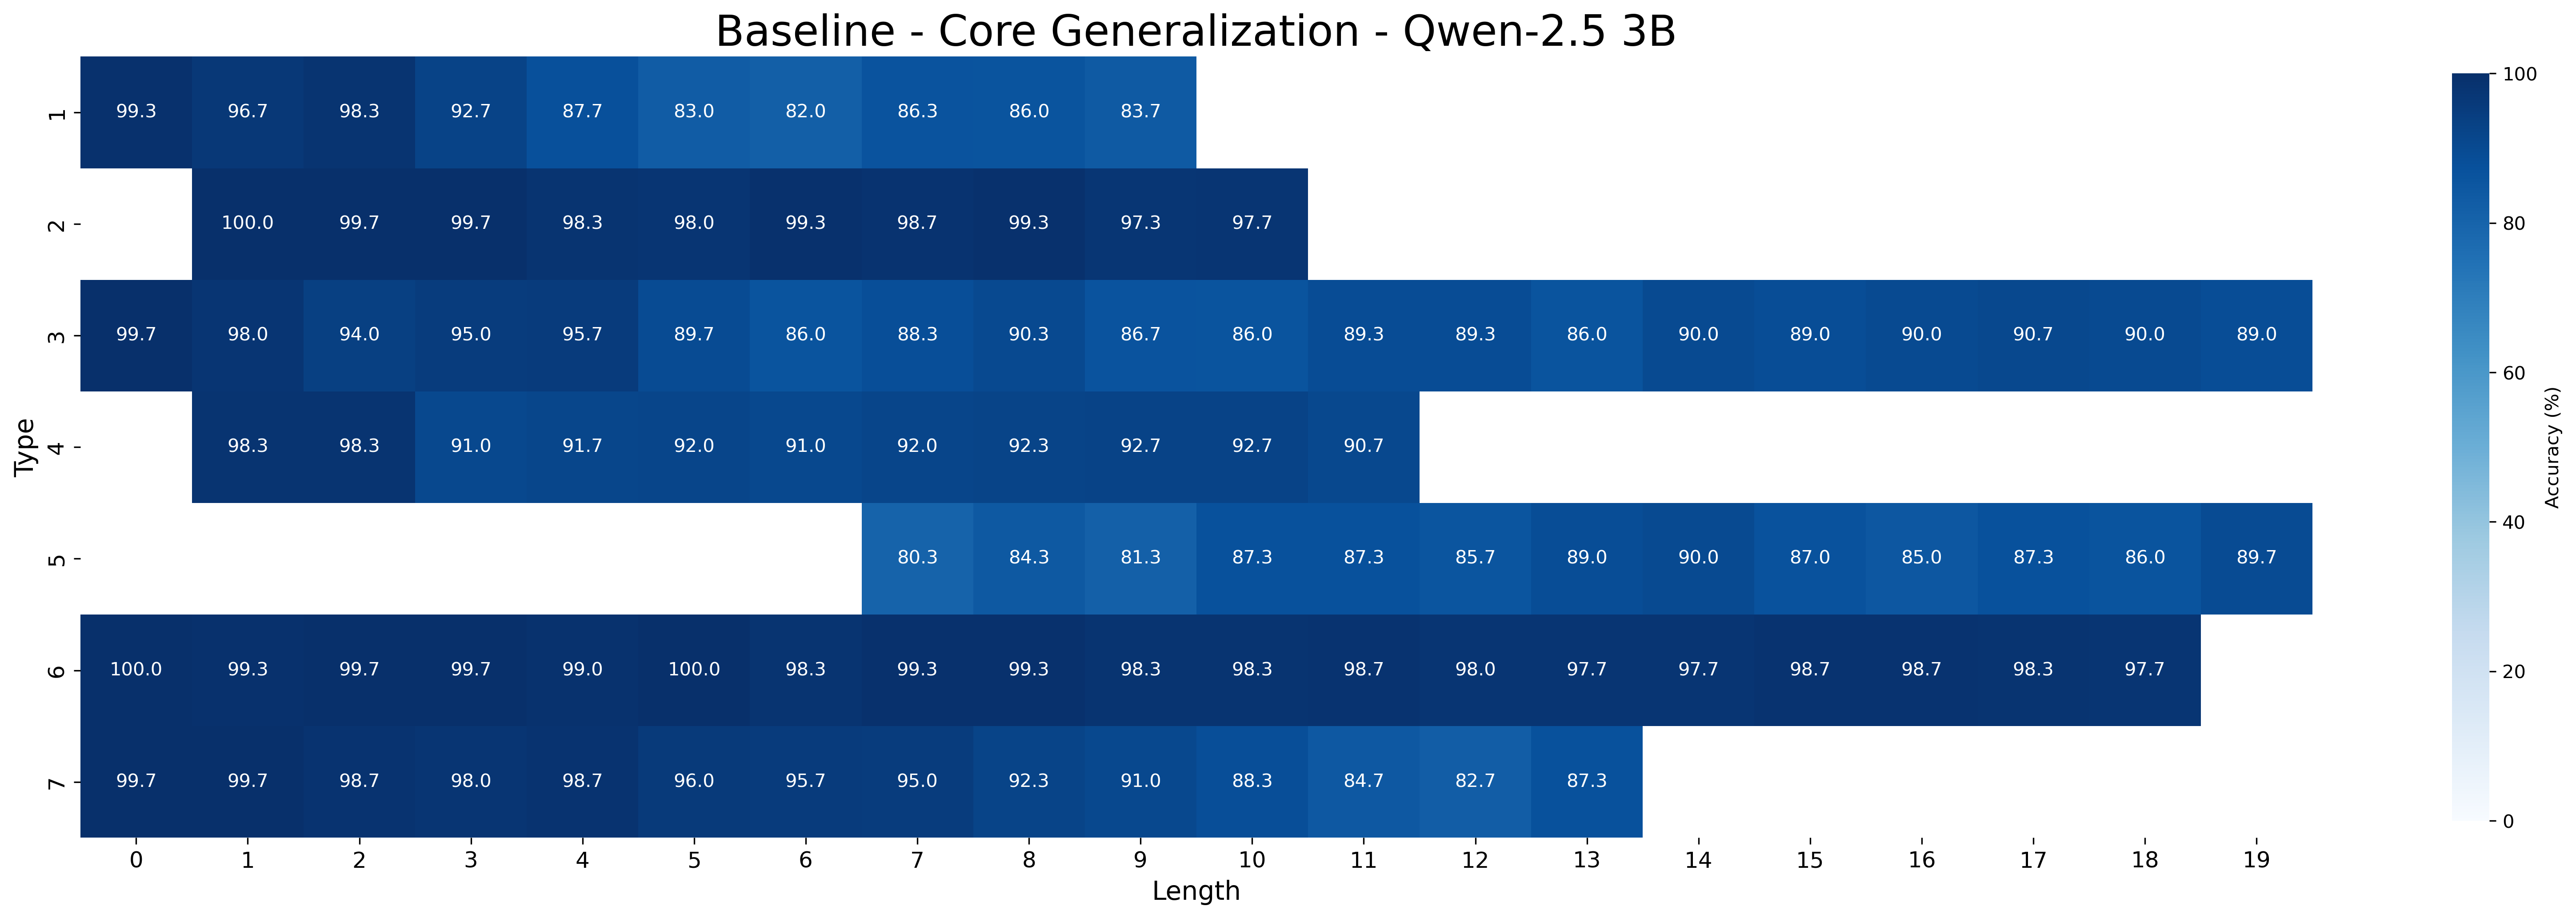
The image is a heatmap visualizing the accuracy of a model (Qwen-2.5 3B) across different types and lengths. The heatmap uses a color gradient from light blue to dark blue to represent accuracy percentages, ranging from 0% to 100%. The x-axis represents the length, and the y-axis represents the type.
### Components/Axes
* **Title:** Baseline - Core Generalization - Qwen-2.5 3B
* **X-axis:** Length (ranging from 0 to 19)
* **Y-axis:** Type (ranging from 1 to 7)
* **Color Legend (right side):** Accuracy (%)
* Darkest Blue: 100%
* Lightest Blue: 0%
* Intermediate markers: 80%, 60%, 40%, 20%
### Detailed Analysis
The heatmap displays accuracy values for different "Types" (1-7) at varying "Lengths" (0-19). Each cell in the heatmap contains a numerical value representing the accuracy percentage.
* **Type 1:**
* Length 0: 99.3%
* Length 1: 96.7%
* Length 2: 98.3%
* Length 3: 92.7%
* Length 4: 87.7%
* Length 5: 83.0%
* Length 6: 82.0%
* Length 7: 86.3%
* Length 8: 86.0%
* Length 9: 83.7%
* **Type 2:**
* Length 1: 100.0%
* Length 2: 99.7%
* Length 3: 99.7%
* Length 4: 98.3%
* Length 5: 98.0%
* Length 6: 99.3%
* Length 7: 98.7%
* Length 8: 99.3%
* Length 9: 97.3%
* Length 10: 97.7%
* **Type 3:**
* Length 0: 99.7%
* Length 1: 98.0%
* Length 2: 94.0%
* Length 3: 95.0%
* Length 4: 95.7%
* Length 5: 89.7%
* Length 6: 86.0%
* Length 7: 88.3%
* Length 8: 90.3%
* Length 9: 86.7%
* Length 10: 86.0%
* Length 11: 89.3%
* Length 12: 89.3%
* Length 13: 86.0%
* Length 14: 90.0%
* Length 15: 89.0%
* Length 16: 90.0%
* Length 17: 90.7%
* Length 18: 90.0%
* Length 19: 89.0%
* **Type 4:**
* Length 0: 98.3%
* Length 1: 98.3%
* Length 2: 91.0%
* Length 3: 91.7%
* Length 4: 92.0%
* Length 5: 91.0%
* Length 6: 92.0%
* Length 7: 92.3%
* Length 8: 92.7%
* Length 9: 92.7%
* Length 10: 90.7%
* **Type 5:**
* Length 7: 80.3%
* Length 8: 84.3%
* Length 9: 81.3%
* Length 10: 87.3%
* Length 11: 87.3%
* Length 12: 85.7%
* Length 13: 89.0%
* Length 14: 90.0%
* Length 15: 87.0%
* Length 16: 85.0%
* Length 17: 87.3%
* Length 18: 86.0%
* Length 19: 89.7%
* **Type 6:**
* Length 0: 100.0%
* Length 1: 99.3%
* Length 2: 99.7%
* Length 3: 99.7%
* Length 4: 99.0%
* Length 5: 100.0%
* Length 6: 98.3%
* Length 7: 99.3%
* Length 8: 99.3%
* Length 9: 98.3%
* Length 10: 98.3%
* Length 11: 98.7%
* Length 12: 98.0%
* Length 13: 97.7%
* Length 14: 97.7%
* Length 15: 98.7%
* Length 16: 98.7%
* Length 17: 98.3%
* Length 18: 97.7%
* **Type 7:**
* Length 0: 99.7%
* Length 1: 99.7%
* Length 2: 98.7%
* Length 3: 98.0%
* Length 4: 98.7%
* Length 5: 96.0%
* Length 6: 95.7%
* Length 7: 95.0%
* Length 8: 92.3%
* Length 9: 91.0%
* Length 10: 88.3%
* Length 11: 84.7%
* Length 12: 82.7%
* Length 13: 87.3%
### Key Observations
* Types 2 and 6 generally exhibit high accuracy across different lengths.
* Type 5 has data only for lengths 7-19, with accuracy values generally lower than Types 2 and 6.
* Types 1, 3, 4, and 7 show a trend of decreasing accuracy as the length increases, especially after length 5.
### Interpretation
The heatmap provides insights into the performance of the Qwen-2.5 3B model under different conditions. The "Type" could represent different categories or tasks, and the "Length" could refer to the input sequence length. The data suggests that the model performs well on Types 2 and 6, maintaining high accuracy even with increasing length. However, for Types 1, 3, 4, and 7, the model's accuracy decreases as the input length increases, indicating potential challenges in handling longer sequences for these specific types. Type 5 appears to be a special case, with data only available for longer lengths, and its performance is generally lower compared to Types 2 and 6. This information can be used to further investigate the model's strengths and weaknesses and guide future improvements.