## Heatmap: Baseline - Core Generalization - Qwen-2.5 3B
### Overview
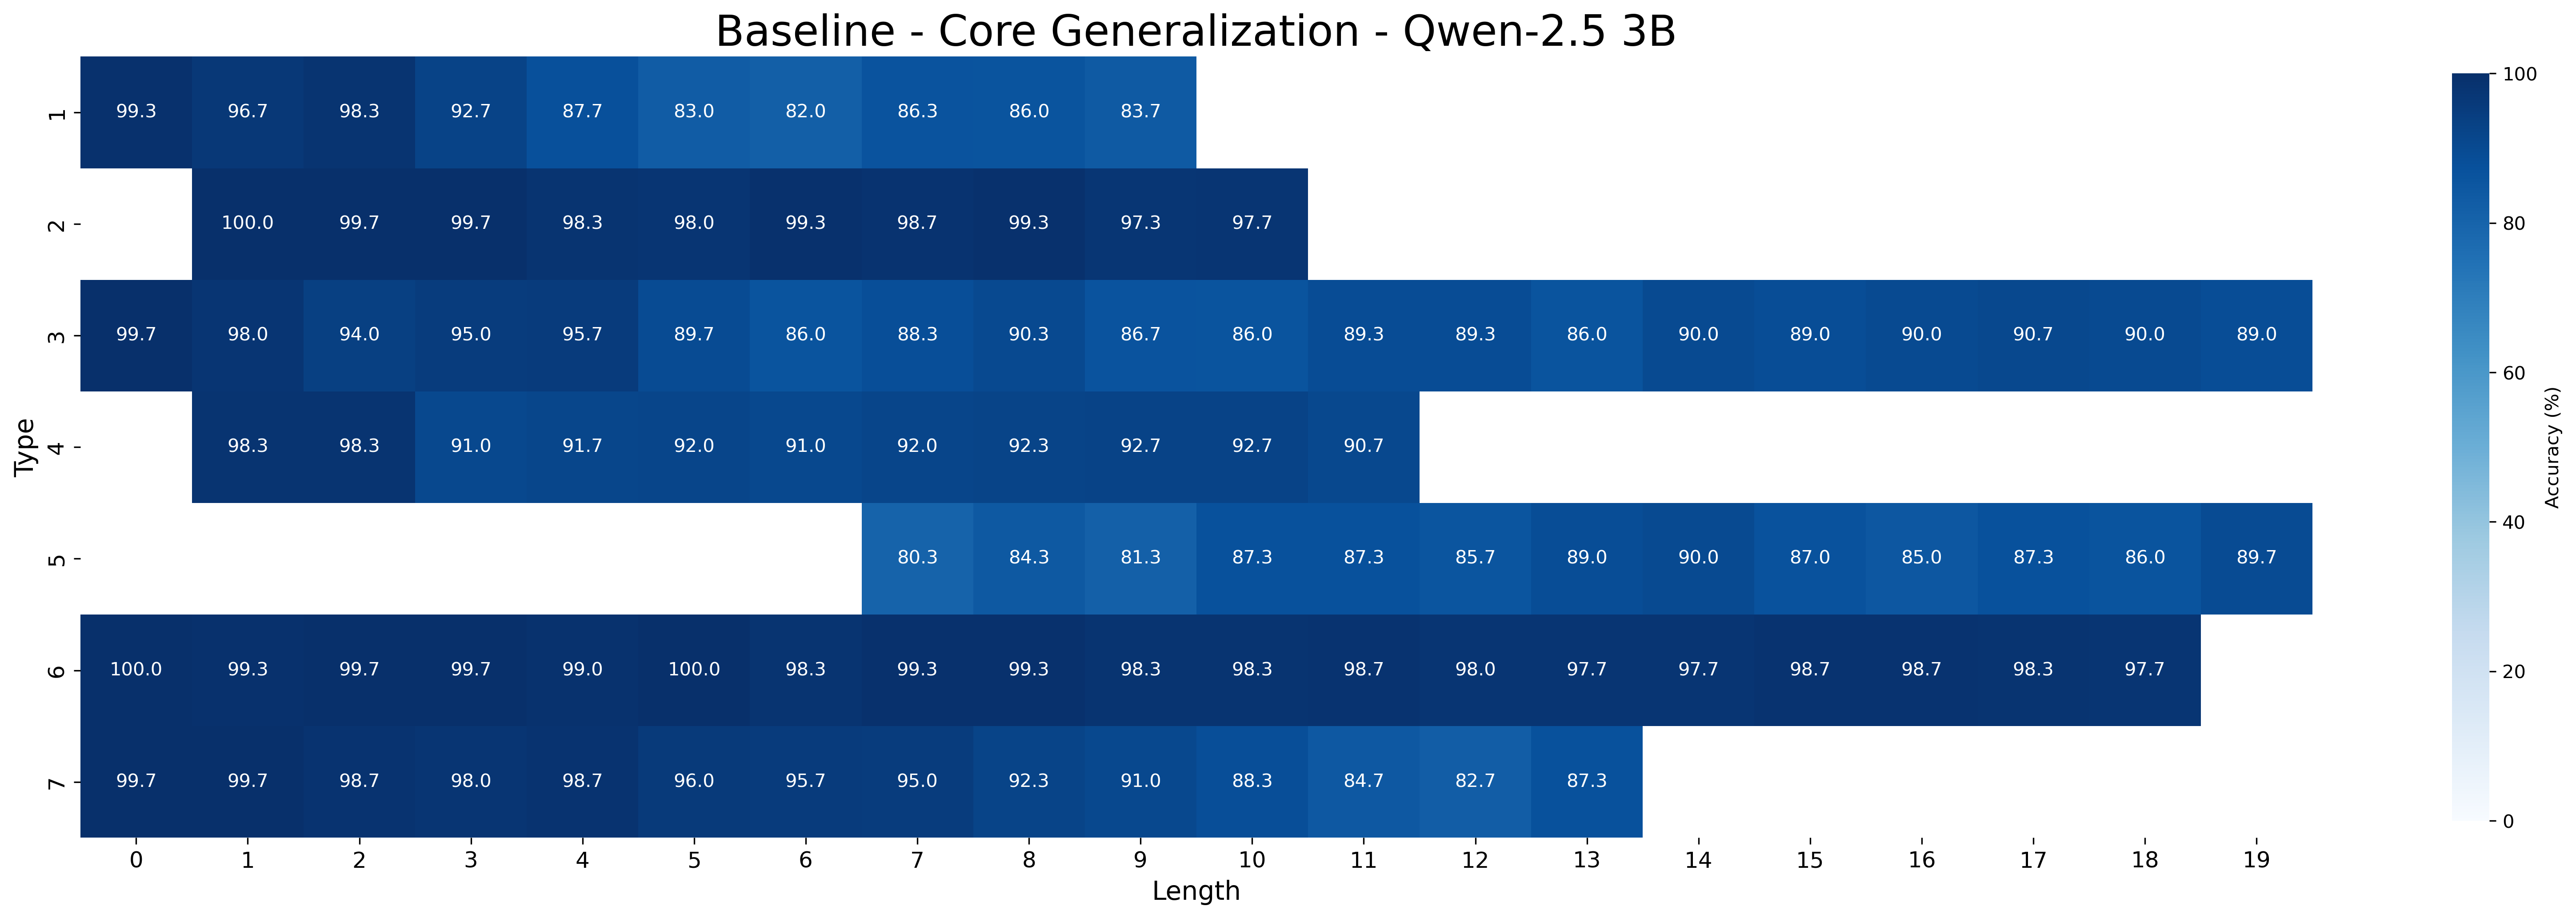
This image is a heatmap visualizing the accuracy (in percentage) of a model named "Qwen-2.5 3B" on a "Core Generalization" task. The performance is broken down by two dimensions: "Type" (y-axis, categories 1-7) and "Length" (x-axis, values 0-19). The color intensity represents accuracy, with a scale from 0% (lightest) to 100% (darkest blue). The chart shows how model performance varies across different task types and sequence lengths.
### Components/Axes
* **Title:** "Baseline - Core Generalization - Qwen-2.5 3B" (Top center).
* **Y-Axis (Vertical):** Labeled "Type". Categories are numbered 1 through 7 from top to bottom.
* **X-Axis (Horizontal):** Labeled "Length". Values range from 0 to 19 from left to right.
* **Color Bar/Legend:** Located on the right side. It is a vertical gradient bar labeled "Accuracy (%)". The scale runs from 0 at the bottom to 100 at the top, with tick marks at 0, 20, 40, 60, 80, and 100. Darker blue corresponds to higher accuracy.
* **Data Cells:** Each cell in the grid contains a numerical accuracy value. Cells with no data are left blank (white).
### Detailed Analysis
The following table reconstructs the accuracy data for each Type across the available Lengths. Empty cells indicate no data for that Type-Length combination.
| Type | Length 0 | Length 1 | Length 2 | Length 3 | Length 4 | Length 5 | Length 6 | Length 7 | Length 8 | Length 9 | Length 10 | Length 11 | Length 12 | Length 13 | Length 14 | Length 15 | Length 16 | Length 17 | Length 18 | Length 19 |
| :--- | :--- | :--- | :--- | :--- | :--- | :--- | :--- | :--- | :--- | :--- | :--- | :--- | :--- | :--- | :--- | :--- | :--- | :--- | :--- | :--- |
| **1** | 99.3 | 96.7 | 98.3 | 92.7 | 87.7 | 83.0 | 82.0 | 86.3 | 86.0 | 83.7 | | | | | | | | | | |
| **2** | | 100.0 | 99.7 | 99.7 | 98.3 | 98.0 | 99.3 | 98.7 | 99.3 | 97.3 | 97.7 | | | | | | | | | |
| **3** | 99.7 | 98.0 | 94.0 | 95.0 | 95.7 | 89.7 | 86.0 | 88.3 | 90.3 | 86.7 | 86.0 | 89.3 | 89.3 | 86.0 | 90.0 | 89.0 | 90.0 | 90.7 | 90.0 | 89.0 |
| **4** | | 98.3 | 98.3 | 91.0 | 91.7 | 92.0 | 91.0 | 92.0 | 92.3 | 92.7 | 92.7 | 90.7 | | | | | | | | |
| **5** | | | | | | | | 80.3 | 84.3 | 81.3 | 87.3 | 87.3 | 85.7 | 89.0 | 90.0 | 87.0 | 85.0 | 87.3 | 86.0 | 89.7 |
| **6** | 100.0 | 99.3 | 99.7 | 99.7 | 99.0 | 100.0 | 98.3 | 99.3 | 99.3 | 98.3 | 98.3 | 98.7 | 98.0 | 97.7 | 97.7 | 98.7 | 98.7 | 98.3 | 97.7 | |
| **7** | 99.7 | 99.7 | 98.7 | 98.0 | 98.7 | 96.0 | 95.7 | 95.0 | 92.3 | 91.0 | 88.3 | 84.7 | 82.7 | 87.3 | | | | | | |
**Trend Verification by Type:**
* **Type 1:** Shows a general downward trend. Accuracy starts very high (99.3% at Length 0) and declines to the low 80s by Length 9.
* **Type 2:** Maintains exceptionally high accuracy (97.3% - 100.0%) across its available lengths (1-10), with minimal degradation.
* **Type 3:** Exhibits a fluctuating but relatively stable trend after an initial drop. Accuracy starts at 99.7%, dips into the mid-80s, and then stabilizes in the 86-90% range for longer lengths.
* **Type 4:** Shows stable performance, mostly in the 91-92% range, with a slight peak at Lengths 9-10 (92.7%).
* **Type 5:** Starts at a lower accuracy (80.3% at Length 7) and shows a slight, inconsistent upward trend, reaching 89.7% at Length 19.
* **Type 6:** Demonstrates the most consistent and highest performance, with accuracy almost exclusively between 97.7% and 100.0% across all measured lengths (0-18).
* **Type 7:** Shows a clear downward trend. Accuracy begins at 99.7% and steadily decreases to 82.7% at Length 12, with a slight recovery at Length 13 (87.3%).
### Key Observations
1. **Performance Variability:** There is significant variability in performance across the different "Types". Type 6 is the top performer, while Type 5 shows the lowest initial accuracy.
2. **Length Sensitivity:** Some types are highly sensitive to length (e.g., Types 1 and 7 show clear degradation), while others are robust (e.g., Types 2 and 6 maintain high accuracy).
3. **Data Coverage:** Not all Types have data for all Lengths. Type 3 has the most complete data (Lengths 0-19). Types 1, 2, 4, and 7 have data only for shorter to medium lengths. Type 5 only has data for longer lengths (7-19).
4. **High-Accuracy Clusters:** The darkest blue cells (accuracy >98%) are concentrated in the top-left region of the chart (shorter lengths for Types 1, 2, 3, 6, 7) and throughout Type 6.
### Interpretation
This heatmap provides a diagnostic view of the Qwen-2.5 3B model's generalization capabilities. The "Type" axis likely represents different categories or tasks within the "Core Generalization" benchmark, while "Length" probably refers to the sequence length or complexity of the input.
* **Model Strengths:** The model exhibits strong and robust performance on Type 6 tasks across all lengths, suggesting a particular strength in that category. It also performs very well on shorter sequences for most types.
* **Model Weaknesses:** The model struggles with Type 5 tasks, especially at shorter lengths. It also shows a clear vulnerability to increasing sequence length for Types 1 and 7, where accuracy drops by over 10 percentage points.
* **Generalization Pattern:** The data suggests that the model's ability to generalize is not uniform. Its performance is highly dependent on the specific nature of the task (Type) and the length of the input. The degradation with length for some types indicates a potential limitation in handling long-range dependencies or maintaining context for those specific tasks.
* **Practical Implication:** For users of this model, this chart indicates that performance will be most reliable for Type 6 tasks and for shorter inputs across most categories. When dealing with Type 5 tasks or long sequences of Type 1 or 7, one should expect lower and potentially declining accuracy.