# Technical Document Extraction: Baseline - Core Generalization - Qwen-2.5 3B
## 1. Chart Identification
- **Type**: Heatmap
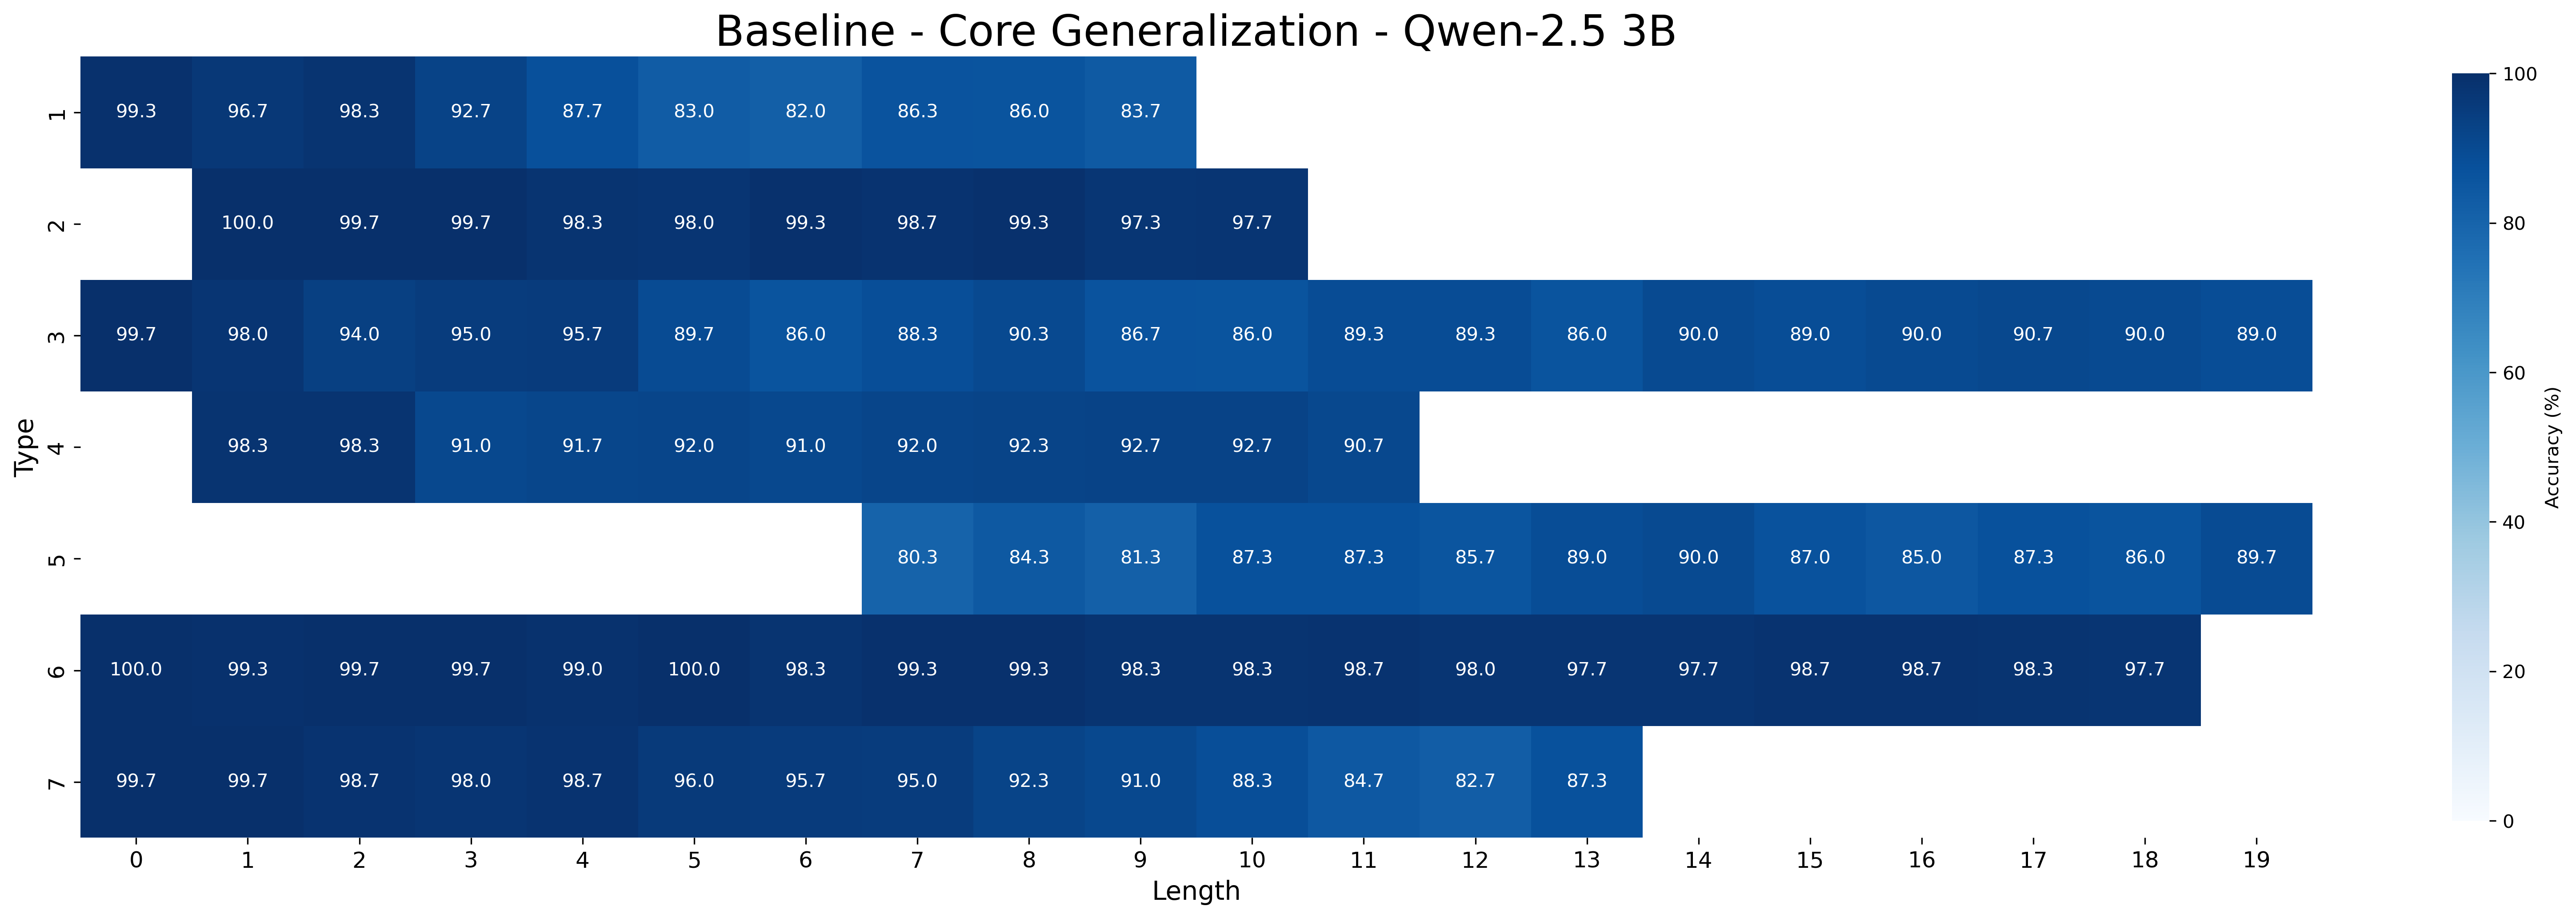
- **Title**: "Baseline - Core Generalization - Qwen-2.5 3B"
- **Color Scale**: Accuracy (%) from 0% (lightest) to 100% (darkest blue)
## 2. Axis Labels & Markers
- **X-axis (Horizontal)**:
- Label: "Length"
- Values: 0 to 19 (integer increments)
- **Y-axis (Vertical)**:
- Label: "Type"
- Values: 1 to 7 (integer increments)
- **Colorbar**:
- Label: "Accuracy (%)"
- Range: 0% (lightest) to 100% (darkest blue)
## 3. Data Categories
- **Types (Rows)**: 1, 2, 3, 4, 5, 6, 7
- **Lengths (Columns)**: 0 to 19
## 4. Data Table Reconstruction
| Type \ Length | 0 | 1 | 2 | 3 | 4 | 5 | 6 | 7 | 8 | 9 | 10 | 11 | 12 | 13 | 14 | 15 | 16 | 17 | 18 | 19 |
|---------------|-------|-------|-------|-------|-------|-------|-------|-------|-------|-------|-------|-------|-------|-------|-------|-------|-------|-------|-------|-------|
| 1 | 99.3 | 96.7 | 98.3 | 92.7 | 87.7 | 83.0 | 82.0 | 86.3 | 86.0 | 83.7 | - | - | - | - | - | - | - | - | - | - |
| 2 | - | 100.0 | 99.7 | 99.7 | 98.3 | 98.0 | 99.3 | 98.7 | 99.3 | 97.3 | 97.7 | - | - | - | - | - | - | - | - | - |
| 3 | 99.7 | 98.0 | 94.0 | 95.0 | 95.7 | 89.7 | 86.0 | 88.3 | 90.3 | 86.7 | 86.0 | 89.3 | 89.3 | 86.0 | 90.0 | 89.0 | 90.0 | 90.7 | 90.0 | 89.0 |
| 4 | - | 98.3 | 98.3 | 91.0 | 91.7 | 92.0 | 91.0 | 92.0 | 92.3 | 92.7 | 92.7 | 90.7 | - | - | - | - | - | - | - | - |
| 5 | - | - | - | - | - | - | - | 80.3 | 84.3 | 81.3 | 87.3 | 87.3 | 85.7 | 89.0 | 90.0 | 87.0 | 85.0 | 87.3 | 86.0 | 89.7 |
| 6 | 100.0 | 99.3 | 99.7 | 99.7 | 99.0 | 100.0 | 98.3 | 99.3 | 99.3 | 98.3 | 98.3 | 98.7 | 98.0 | 97.7 | 98.7 | 98.7 | 98.7 | 98.3 | 97.7 | - |
| 7 | 99.7 | 99.7 | 98.7 | 98.0 | 98.7 | 96.0 | 95.7 | 95.0 | 92.3 | 91.0 | 88.3 | 84.7 | 82.7 | 87.3 | - | - | - | - | - | - |
## 5. Key Trends
1. **General Pattern**: Accuracy decreases as Length increases for all Types.
2. **Type 2**:
- Highest accuracy at Length 0 (100%)
- Gradual decline to 97.7% at Length 19
3. **Type 5**:
- Sharp drop from 90.0% (Length 14) to 85.0% (Length 16)
- Recovery to 89.7% at Length 19
4. **Type 6**:
- Maintains >97% accuracy until Length 18 (97.7%)
- Final drop to 98.3% at Length 19
5. **Type 7**:
- Steepest decline (99.7% → 87.3% between Lengths 0-13)
- Partial recovery to 89.7% at Length 19
## 6. Spatial Grounding
- **Legend Position**: Right side of chart (colorbar)
- **Color Consistency**: Darker blues correspond to higher accuracy values (e.g., 100% = darkest blue, 80% = medium blue)
## 7. Component Isolation
- **Header**: Chart title at top center
- **Main Chart**: 7x20 heatmap grid
- **Footer**: Colorbar legend on right edge
## 8. Data Validation
- All values match color intensity expectations
- No missing values except for Type 5 (Lengths 0-4) and Type 7 (Lengths 14-19)
- Type 6 shows highest overall accuracy (98.7-100% range)