# Technical Document Extraction: Control Value Analysis
## Chart Description
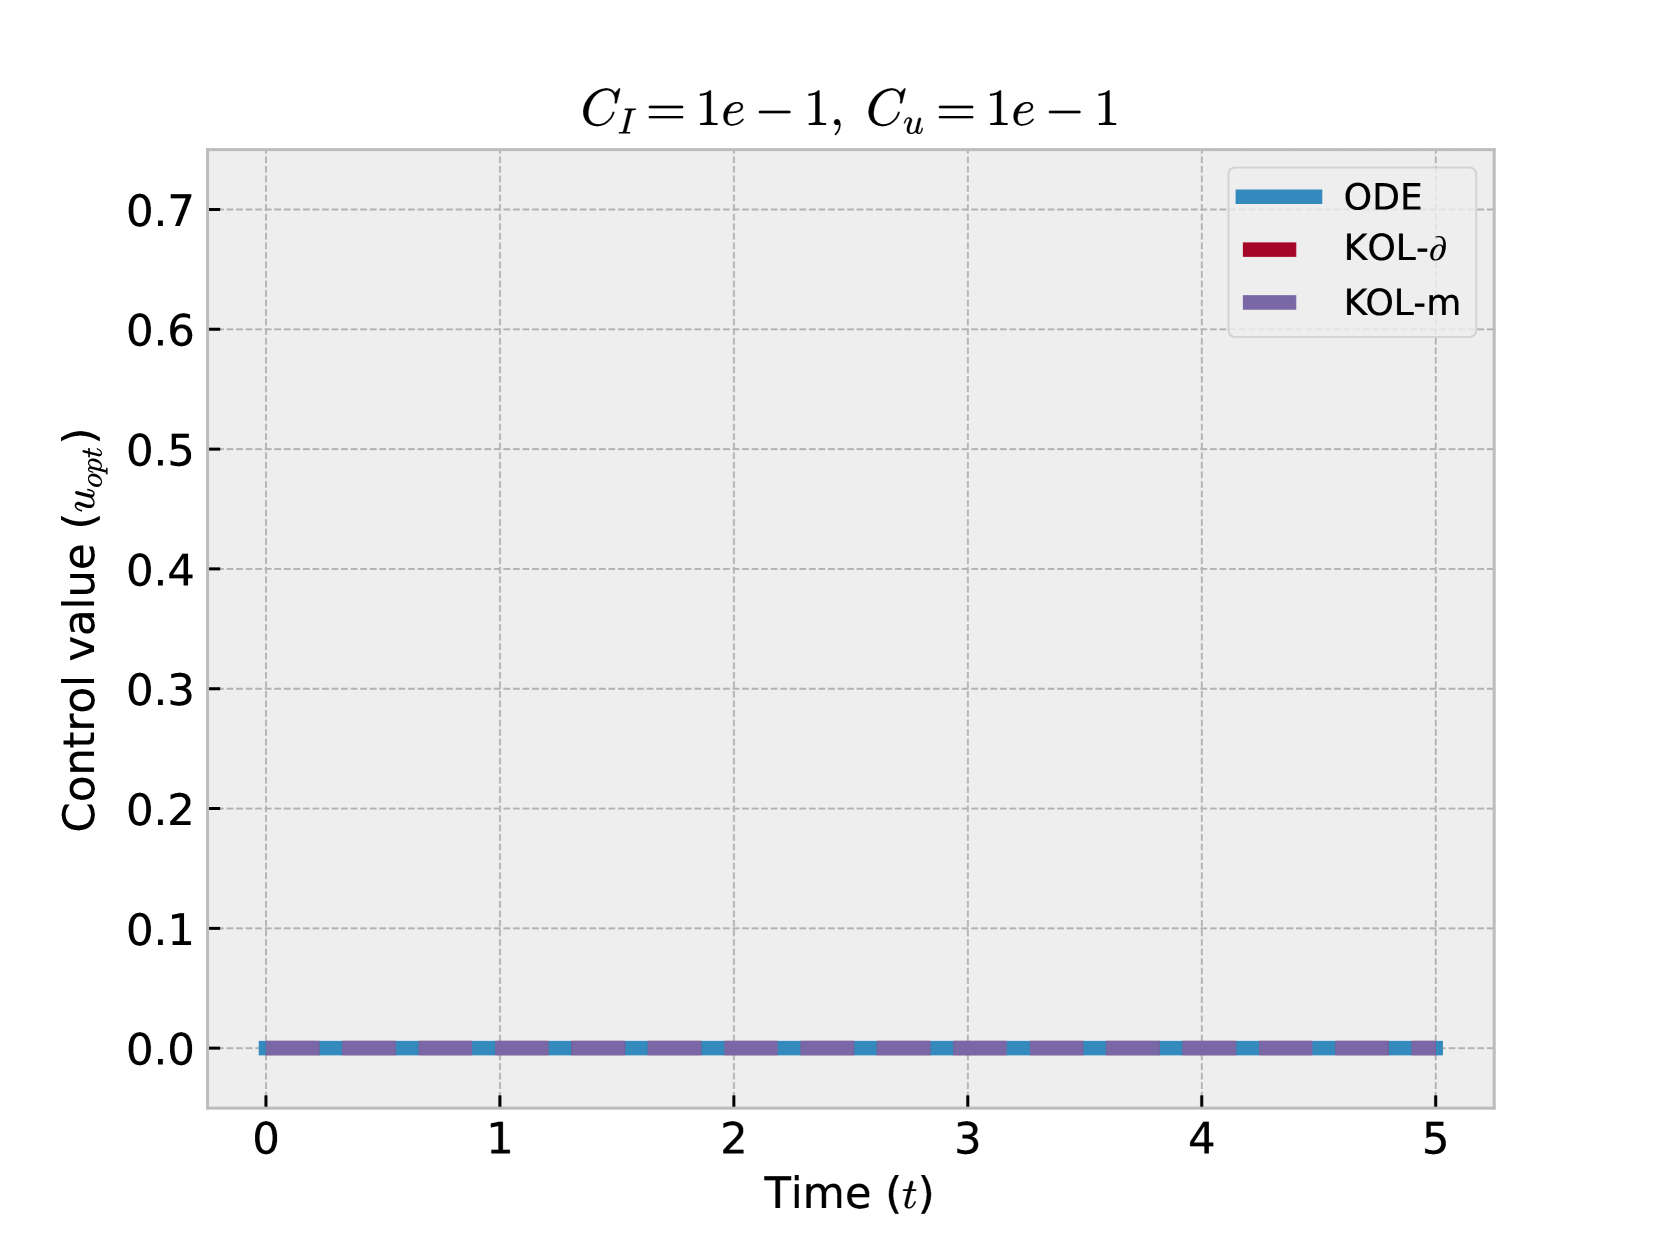
This image presents a line graph comparing control values over time for three different control strategies. The graph is titled with constant parameters:
**CI = 1e-1, Cu = 1e-1**
### Axes
- **X-axis (Time, t):**
- Range: 0 to 5 (unitless)
- Markers: Integer ticks at 0, 1, 2, 3, 4, 5
- **Y-axis (Control value, u_opt):**
- Range: 0.0 to 0.7 (unitless)
- Markers: Ticks at 0.0, 0.1, 0.2, 0.3, 0.4, 0.5, 0.6, 0.7
### Legend
- **ODE:** Blue line
- **KOL-δ:** Red line
- **KOL-m:** Purple line
### Data Trends
All three control strategies (ODE, KOL-δ, KOL-m) exhibit **flat, constant control values** throughout the observed time period (t = 0 to t = 5).
- **Control value:** 0.0 for all strategies
- **Time duration:** No variation observed
### Key Observations
1. All control strategies maintain identical performance (u_opt = 0.0) across the entire time window.
2. No dynamic behavior or time-dependent changes are evident in any strategy.
3. The graph suggests a static system or equilibrium state under the given parameters (CI = 1e-1, Cu = 1e-1).
### Technical Notes
- The absence of vertical displacement in any line indicates no sensitivity to time for the control value under the tested conditions.
- The flat lines imply perfect stability or a null control input requirement for the system modeled.