\n
## Line Chart: EGA vs. Number of Human-Written Plans
### Overview
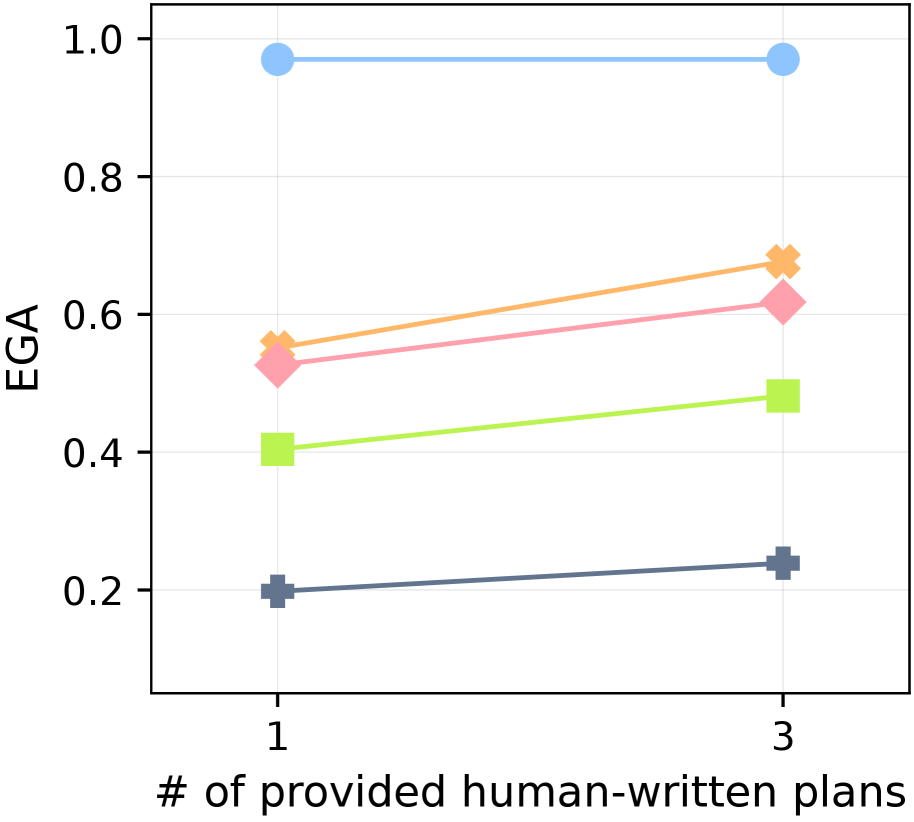
This image presents a line chart illustrating the relationship between the number of provided human-written plans and the EGA (likely an evaluation metric). The chart displays data for four different series, each represented by a distinct colored line. The x-axis represents the number of plans (1 or 3), and the y-axis represents the EGA score, ranging from 0 to 1.
### Components/Axes
* **X-axis Label:** "# of provided human-written plans"
* **X-axis Markers:** 1, 3
* **Y-axis Label:** "EGA"
* **Y-axis Scale:** 0.0 to 1.0, with increments of 0.2
* **Data Series:** Four lines, each with a unique color:
* Blue
* Orange
* Pink
* Green
### Detailed Analysis
Let's analyze each line individually, noting the trend and approximate data points.
* **Blue Line:** This line is relatively flat. It starts at approximately 0.95 when the number of plans is 1 and ends at approximately 0.97 when the number of plans is 3.
* **Orange Line:** This line slopes upward. It begins at approximately 0.55 when the number of plans is 1 and increases to approximately 0.68 when the number of plans is 3.
* **Pink Line:** This line also slopes upward, but less steeply than the orange line. It starts at approximately 0.52 when the number of plans is 1 and rises to approximately 0.63 when the number of plans is 3.
* **Green Line:** This line slopes upward. It begins at approximately 0.42 when the number of plans is 1 and increases to approximately 0.48 when the number of plans is 3.
### Key Observations
* All four lines show a positive correlation between the number of human-written plans and the EGA score. As the number of plans increases, the EGA score tends to increase for all series.
* The blue line exhibits the highest EGA scores across both data points, indicating consistently high performance.
* The green line consistently has the lowest EGA scores.
* The orange line shows the largest increase in EGA score between 1 and 3 plans.
### Interpretation
The data suggests that providing more human-written plans generally leads to improved EGA scores across all evaluated series. This could indicate that human input enhances the performance of the system being evaluated. The consistent high performance of the blue line suggests that this particular series is less sensitive to the number of provided plans, or inherently performs better. The green line's lower scores suggest it may benefit more from additional human input. The upward trends across all lines imply a diminishing return – the increase in EGA score becomes smaller as more plans are provided. This could be due to saturation, where additional plans offer less new information or refinement. The EGA metric is likely measuring the quality or effectiveness of some process, and the human-written plans are serving as a form of guidance or training data. Further investigation would be needed to understand the specific meaning of EGA and the nature of the plans.