\n
## Diagram: Neural Network Architectures
### Overview
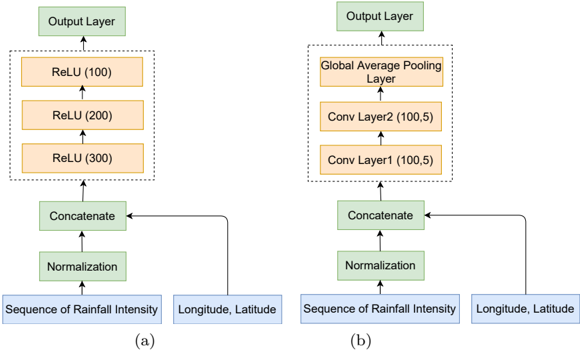
The image presents a comparison of two neural network architectures, labeled (a) and (b). Both architectures are designed to process "Sequence of Rainfall Intensity" and "Longitude, Latitude" as input, ultimately leading to an "Output Layer". The diagrams illustrate the flow of data through different layers within each network.
### Components/Axes
The diagram consists of rectangular blocks representing layers, with arrows indicating the direction of data flow. The key components are:
* **Input Layers:** "Sequence of Rainfall Intensity" and "Longitude, Latitude"
* **Normalization:** A green rectangular block.
* **Concatenate:** A light-green rectangular block.
* **Architecture (a):**
* ReLU (300) - Orange rectangular block.
* ReLU (200) - Orange rectangular block.
* ReLU (100) - Orange rectangular block.
* Output Layer - Light-blue rectangular block.
* **Architecture (b):**
* Conv Layer1 (100,5) - Light-blue rectangular block.
* Conv Layer2 (100,5) - Light-blue rectangular block.
* Global Average Pooling Layer - Light-blue rectangular block.
* Output Layer - Light-blue rectangular block.
### Detailed Analysis or Content Details
**Architecture (a):**
1. The "Sequence of Rainfall Intensity" and "Longitude, Latitude" inputs are fed into a "Normalization" layer.
2. The output of the "Normalization" layer is then passed to a "Concatenate" layer.
3. The concatenated data flows through three ReLU layers sequentially:
* ReLU (300)
* ReLU (200)
* ReLU (100)
4. Finally, the output of the last ReLU layer is fed into the "Output Layer".
**Architecture (b):**
1. Similar to (a), the "Sequence of Rainfall Intensity" and "Longitude, Latitude" inputs are fed into a "Normalization" layer.
2. The output of the "Normalization" layer is then passed to a "Concatenate" layer.
3. The concatenated data flows through two Convolutional layers sequentially:
* Conv Layer1 (100,5)
* Conv Layer2 (100,5)
4. The output of the second convolutional layer is then passed to a "Global Average Pooling Layer".
5. Finally, the output of the "Global Average Pooling Layer" is fed into the "Output Layer".
### Key Observations
* Architecture (a) utilizes a series of fully connected ReLU layers, while architecture (b) employs convolutional layers followed by global average pooling.
* The ReLU layers in architecture (a) have decreasing numbers of units (300, 200, 100), potentially indicating a reduction in dimensionality.
* The convolutional layers in architecture (b) both have 100 filters with a kernel size of 5x5 (indicated by "100,5").
* Both architectures share the same input and output layers, suggesting they are designed for the same task but differ in their internal processing.
### Interpretation
The diagram illustrates two different approaches to building a neural network for a rainfall intensity prediction task. Architecture (a) represents a more traditional, fully connected neural network, while architecture (b) leverages convolutional layers, which are commonly used for spatial data processing. The use of convolutional layers in (b) suggests that the network is designed to exploit spatial correlations within the rainfall intensity and location data. The global average pooling layer in (b) reduces the spatial dimensions, making the network more robust to variations in input size and potentially reducing overfitting. The choice between these architectures likely depends on the specific characteristics of the rainfall data and the desired trade-off between model complexity and performance. The decreasing number of units in the ReLU layers of architecture (a) suggests a funneling of information, potentially extracting higher-level features.