## Diagram: Neural Network Architectures for Spatiotemporal Data Processing
### Overview
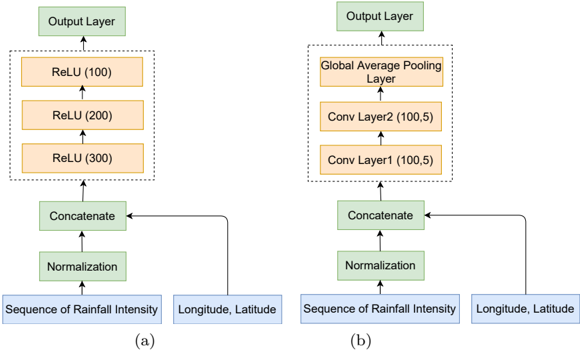
The image displays a side-by-side comparison of two distinct neural network architectures, labeled (a) and (b), designed to process spatiotemporal data. Both models share identical input structures but employ different internal processing layers before reaching an output layer. The diagram uses a flowchart style with colored boxes and directional arrows to illustrate data flow.
### Components/Axes
**Common Input Structure (Bottom of both diagrams):**
* **Input 1 (Blue Box, Bottom-Left):** "Sequence of Rainfall Intensity"
* **Input 2 (Blue Box, Bottom-Right):** "Longitude, Latitude"
* **Processing Block (Green Boxes, above inputs):**
1. "Normalization" (receives "Sequence of Rainfall Intensity")
2. "Concatenate" (receives output from "Normalization" and the raw "Longitude, Latitude" input)
**Architecture (a) - Left Side:**
* **Hidden Layers (Orange Boxes, within a dashed rectangle):** A stack of three fully connected layers with ReLU activation.
* Bottom Layer: "ReLU (300)"
* Middle Layer: "ReLU (200)"
* Top Layer: "ReLU (100)"
* **Output Layer (Green Box, Top):** "Output Layer"
**Architecture (b) - Right Side:**
* **Hidden Layers (Orange Boxes, within a dashed rectangle):** A stack of two convolutional layers followed by a pooling layer.
* Bottom Layer: "Conv Layer1 (100,5)"
* Middle Layer: "Conv Layer2 (100,5)"
* Top Layer: "Global Average Pooling Layer"
* **Output Layer (Green Box, Top):** "Output Layer"
**Labels:**
* The letter "(a)" is positioned below the left architecture.
* The letter "(b)" is positioned below the right architecture.
### Detailed Analysis
**Data Flow in Architecture (a):**
1. The "Sequence of Rainfall Intensity" is normalized.
2. The normalized sequence is concatenated with the "Longitude, Latitude" coordinates.
3. The concatenated vector is passed sequentially through three fully connected (ReLU) layers. The number of neurons decreases from 300 to 200 to 100.
4. The final 100-neuron layer feeds into the "Output Layer".
**Data Flow in Architecture (b):**
1. The "Sequence of Rainfall Intensity" is normalized.
2. The normalized sequence is concatenated with the "Longitude, Latitude" coordinates.
3. The concatenated data is processed by two convolutional layers ("Conv Layer1" and "Conv Layer2"). The notation "(100,5)" likely indicates 100 filters with a kernel size of 5.
4. The output of the second convolutional layer is processed by a "Global Average Pooling Layer".
5. The pooled features feed into the "Output Layer".
### Key Observations
1. **Input Consistency:** Both models are designed for the same task, taking a temporal sequence (rainfall) and spatial coordinates as input.
2. **Architectural Divergence:** The core difference lies in the hidden layers. Model (a) uses a traditional Multi-Layer Perceptron (MLP) structure with decreasing layer sizes. Model (b) uses a Convolutional Neural Network (CNN) structure, which is typically better at capturing spatial or local patterns in data.
3. **Parameter Notation:** The numbers in parentheses for the ReLU layers (e.g., "300") denote the number of neurons. For the Conv layers, "(100,5)" denotes filter count and kernel size.
4. **Visual Grouping:** The dashed rectangles clearly group the core processing layers specific to each architecture, separating them from the common input and output stages.
### Interpretation
This diagram compares two fundamental approaches for modeling spatiotemporal environmental data (rainfall over geographic coordinates).
* **Architecture (a) - MLP Approach:** This model treats the concatenated input (rainfall sequence + coordinates) as a flat feature vector. The decreasing layer size (300→200→100) suggests a bottleneck design, forcing the network to learn compressed, hierarchical representations. It may be effective if the relationships between rainfall, time, and location are relatively straightforward and global.
* **Architecture (b) - CNN Approach:** This model is more specialized. The convolutional layers are designed to detect local patterns within the input data. Given the inputs, the CNN might be learning local spatial correlations (how rainfall at one location relates to nearby coordinates) or temporal patterns within the rainfall sequence. The "Global Average Pooling Layer" is a modern technique that reduces spatial dimensions, provides some translation invariance, and helps prevent overfitting.
* **Underlying Hypothesis:** The comparison suggests an investigation into whether spatial and temporal patterns in rainfall data are better captured by a general-purpose MLP or a pattern-sensitive CNN. The CNN architecture (b) is generally more complex and data-hungry but has a stronger inductive bias for grid-like or sequential data, which could lead to better performance if sufficient training data is available. The choice between them would depend on the specific structure of the "Sequence of Rainfall Intensity" (e.g., is it a time series per location, or a spatial grid over time?) and the ultimate prediction task of the "Output Layer".