## Diagram: Neural Network Architectures for Rainfall Intensity Prediction
### Overview
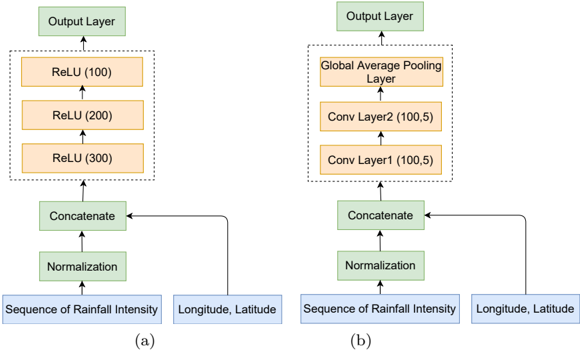
The image presents two neural network architectures (labeled (a) and (b)) designed to process rainfall intensity data combined with geographic coordinates (longitude, latitude). Both architectures include normalization, concatenation, and output layers, but differ in their intermediate processing layers.
### Components/Axes
#### Diagram (a):
- **Inputs**:
- Sequence of Rainfall Intensity
- Longitude, Latitude
- **Layers**:
1. Normalization
2. Concatenate
3. ReLU (100 units)
4. ReLU (200 units)
5. ReLU (300 units)
6. Concatenate
7. Output Layer
#### Diagram (b):
- **Inputs**:
- Sequence of Rainfall Intensity
- Longitude, Latitude
- **Layers**:
1. Normalization
2. Conv Layer 1 (100 filters, kernel size 5)
3. Conv Layer 2 (100 filters, kernel size 5)
4. Global Average Pooling Layer
5. Concatenate
6. Output Layer
### Detailed Analysis
- **Diagram (a)** uses fully connected ReLU layers with increasing units (100 → 200 → 300), suggesting a focus on hierarchical feature extraction.
- **Diagram (b)** incorporates convolutional layers (Conv1, Conv2) with spatial filters (kernel size 5) and a global average pooling layer, indicating an emphasis on spatial feature aggregation.
- Both architectures normalize inputs and concatenate features before final processing.
### Key Observations
1. **Architectural Differences**:
- (a) relies on dense ReLU layers, while (b) uses convolutional layers and global pooling.
- (b) lacks intermediate ReLU layers after convolutional steps, which may simplify gradient flow.
2. **Input Handling**:
- Both architectures normalize inputs, but (b) processes spatial data (longitude, latitude) alongside rainfall sequences, potentially enabling geospatial context integration.
3. **Output**:
- Both end with an output layer, but the absence of explicit activation functions (e.g., softmax, sigmoid) in the diagram leaves the final layer’s purpose ambiguous.
### Interpretation
- **Purpose**: The architectures likely aim to predict rainfall intensity or related metrics, leveraging temporal (rainfall sequences) and spatial (geographic coordinates) data.
- **Design Implications**:
- Diagram (a) may excel at capturing nonlinear temporal patterns due to its dense ReLU layers.
- Diagram (b) prioritizes spatial feature extraction via convolutions and global pooling, which could improve performance on geospatially correlated data.
- **Missing Details**:
- No activation functions are specified for the output layer, which is critical for tasks like regression (linear) or classification (nonlinear).
- The role of concatenation steps (e.g., merging temporal and spatial features) is unclear without context on how these features interact.
## Notes
- The image is a technical diagram, not a chart, so numerical trends or data points are absent.
- Both architectures share normalization and concatenation steps, suggesting a modular design for combining diverse data types.
- The absence of dropout or regularization layers raises questions about overfitting mitigation.