\n
## Horizontal Bar Chart: Benchmark Category Counts
### Overview
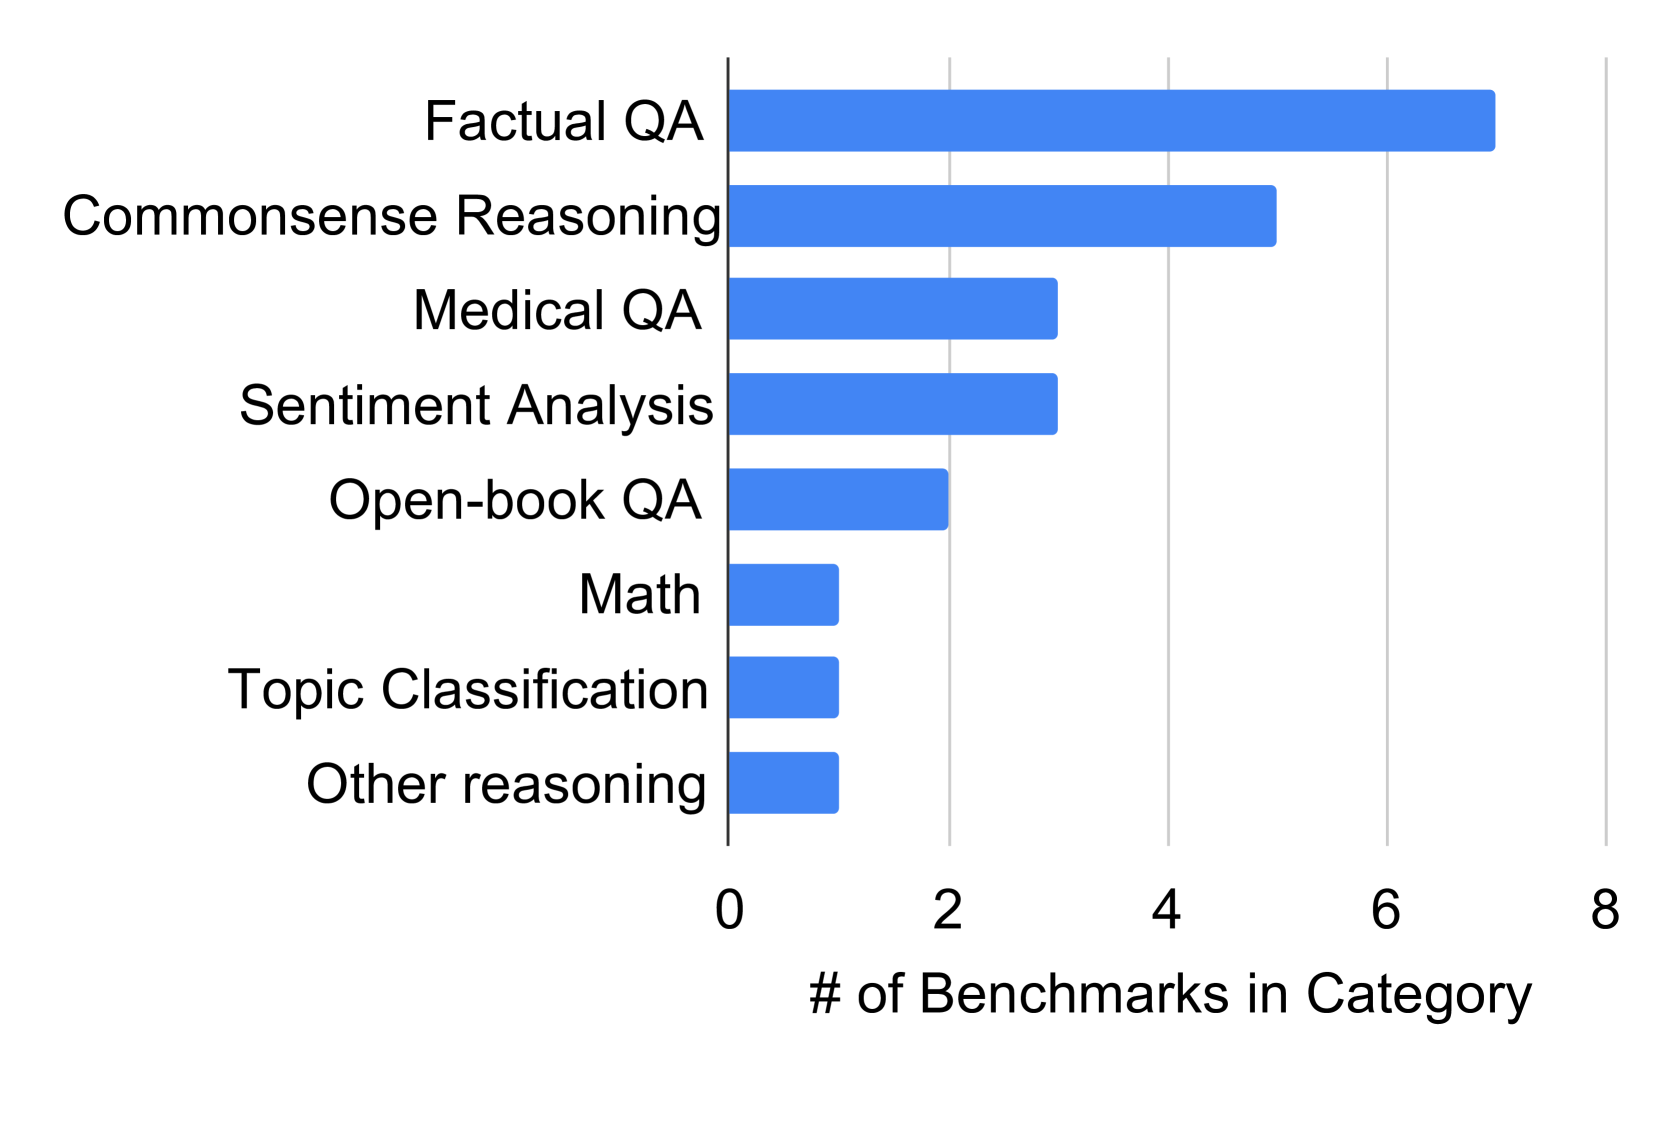
This image presents a horizontal bar chart illustrating the number of benchmarks within different categories of question answering and reasoning tasks. The chart displays the count of benchmarks for each category, ranging from 0 to 8.
### Components/Axes
* **Y-axis (Vertical):** Lists the benchmark categories:
* Factual QA
* Commonsense Reasoning
* Medical QA
* Sentiment Analysis
* Open-book QA
* Math
* Topic Classification
* Other reasoning
* **X-axis (Horizontal):** Represents the "# of Benchmarks in Category", with a scale ranging from 0 to 8, incrementing by 2.
* **Bar Color:** All bars are a uniform blue color.
### Detailed Analysis
The chart shows the following approximate benchmark counts for each category:
* **Factual QA:** The longest bar extends to approximately 7.2 benchmarks.
* **Commonsense Reasoning:** The bar extends to approximately 4.5 benchmarks.
* **Medical QA:** The bar extends to approximately 3.2 benchmarks.
* **Sentiment Analysis:** The bar extends to approximately 3.0 benchmarks.
* **Open-book QA:** The bar extends to approximately 2.5 benchmarks.
* **Math:** The bar extends to approximately 1.2 benchmarks.
* **Topic Classification:** The bar extends to approximately 1.1 benchmarks.
* **Other reasoning:** The bar extends to approximately 1.1 benchmarks.
The bars are arranged vertically, with "Factual QA" at the top and "Other reasoning" at the bottom. The length of each bar corresponds to the number of benchmarks in that category.
### Key Observations
* "Factual QA" has the highest number of benchmarks, significantly more than other categories.
* "Math", "Topic Classification", and "Other reasoning" have the fewest benchmarks, with similar counts.
* There is a clear distinction between the top three categories ("Factual QA", "Commonsense Reasoning", "Medical QA") and the remaining categories.
### Interpretation
The data suggests a strong focus on "Factual QA" benchmarks, potentially indicating a greater emphasis on evaluating models' ability to retrieve and present factual information. The relatively lower number of benchmarks in "Math", "Topic Classification", and "Other reasoning" might indicate less research or evaluation effort in these areas, or that these areas are covered by other benchmark categories. The chart provides a snapshot of the distribution of benchmark efforts across different AI reasoning and QA tasks. It could be used to identify areas where more benchmark development is needed to ensure comprehensive model evaluation. The chart does not provide information on the difficulty or complexity of the benchmarks, only the quantity.