## Bar Chart: Number of Benchmarks in Category
### Overview
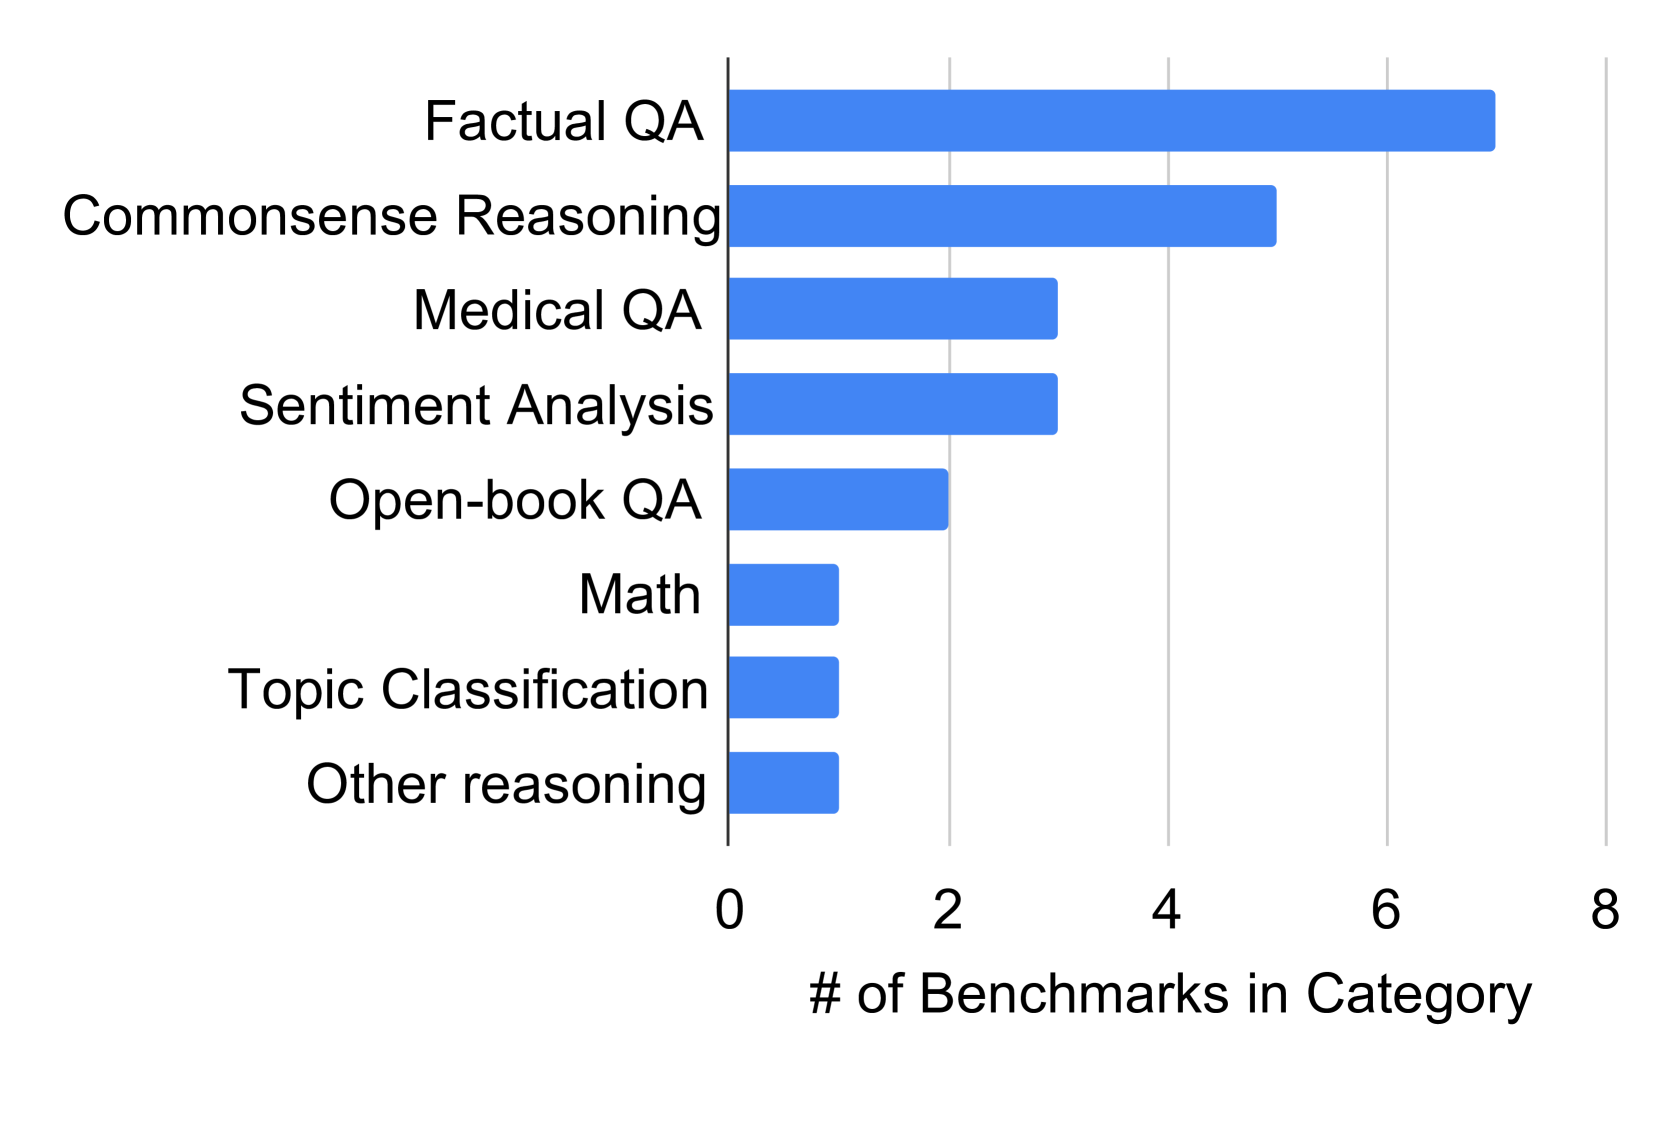
The chart displays a horizontal bar visualization comparing the number of benchmarks across eight categories. The x-axis represents the count of benchmarks (0–8), while the y-axis lists categorical labels. Bars are uniformly blue, with no legend present. The data suggests a hierarchical distribution of benchmark density across categories.
### Components/Axes
- **Y-Axis (Categories)**:
- Factual QA
- Commonsense Reasoning
- Medical QA
- Sentiment Analysis
- Open-book QA
- Math
- Topic Classification
- Other reasoning
- **X-Axis (Scale)**:
- Labeled "# of Benchmarks in Category"
- Range: 0 to 8 (discrete increments)
- **Visual Elements**:
- Horizontal bars (blue) aligned to y-axis categories
- No gridlines or annotations beyond axis labels
### Detailed Analysis
- **Factual QA**: Longest bar, extending to ~7 benchmarks (highest value).
- **Commonsense Reasoning**: Second-longest bar, ~5 benchmarks.
- **Medical QA** and **Sentiment Analysis**: Equal length, ~3 benchmarks each.
- **Open-book QA**: ~2 benchmarks.
- **Math**, **Topic Classification**, and **Other reasoning**: Shortest bars, each ~1 benchmark.
### Key Observations
1. **Dominance of Factual QA**: Factual QA accounts for over 50% of the total benchmarks (~7/13 total).
2. **Mid-Range Categories**: Commonsense Reasoning (~5) and Medical QA/Sentiment Analysis (~3) form the mid-tier.
3. **Low-Density Categories**: Math, Topic Classification, and Other reasoning each have only ~1 benchmark, indicating sparse representation.
4. **Symmetry in Lower Tiers**: The three lowest categories share identical benchmark counts, suggesting potential overlap in evaluation focus or resource allocation.
### Interpretation
The data highlights a stark imbalance in benchmark development across categories. Factual QA and Commonsense Reasoning dominate, reflecting their perceived importance in AI evaluation. The near-absence of benchmarks in Math and Topic Classification may indicate either emerging fields or insufficient prioritization. The clustering of Medical QA and Sentiment Analysis at ~3 benchmarks suggests moderate but distinct evaluation needs. The uniformity of the lowest three categories raises questions about whether these represent niche areas or methodological constraints in benchmark creation. This distribution could inform resource allocation for future benchmark development, emphasizing underrepresented domains like Math and Topic Classification.