\n
## Chart: KG-Trie Performance vs. Path Length
### Overview
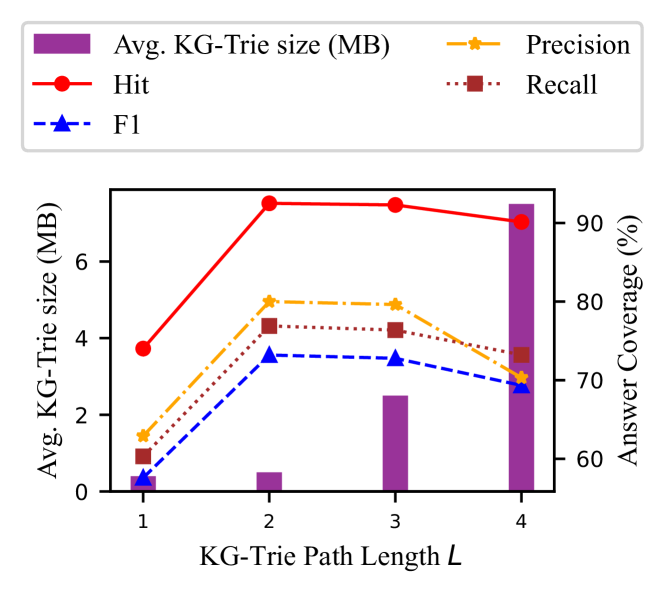
The image presents a chart illustrating the performance of a KG-Trie (Knowledge Graph Trie) system as a function of the KG-Trie path length, denoted as *L*. The chart displays four metrics: Average KG-Trie size (in MB), Hit rate, Precision, and Recall. The Average KG-Trie size is represented by a bar chart, while the other three metrics are plotted as lines against the path length. A secondary y-axis on the right side of the chart represents Answer Coverage (in %).
### Components/Axes
* **X-axis:** KG-Trie Path Length *L* (with markers at 1, 2, 3, and 4)
* **Primary Y-axis (left):** Avg. KG-Trie size (MB) - Scale ranges from 0 to 8.
* **Secondary Y-axis (right):** Answer Coverage (%) - Scale ranges from 60% to 90%.
* **Legend (top-right):**
* Avg. KG-Trie size (MB) - Purple
* Hit - Red
* Precision - Orange
* Recall - Dotted Orange
* F1 - Blue (dashed)
### Detailed Analysis
**Average KG-Trie Size (Purple Bars):**
* L = 1: Approximately 0.4 MB
* L = 2: Approximately 1.2 MB
* L = 3: Approximately 2.4 MB
* L = 4: Approximately 7.2 MB
*Trend:* The average KG-Trie size increases significantly with increasing path length *L*. The increase is roughly exponential.
**Hit Rate (Red Line):**
* L = 1: Approximately 3.8 (Answer Coverage)
* L = 2: Approximately 8.5 (Answer Coverage)
* L = 3: Approximately 8.8 (Answer Coverage)
* L = 4: Approximately 8.8 (Answer Coverage)
*Trend:* The Hit rate increases sharply from L=1 to L=2, then plateaus, remaining relatively constant from L=2 to L=4.
**Precision (Orange Line):**
* L = 1: Approximately 4.2 (Answer Coverage)
* L = 2: Approximately 5.2 (Answer Coverage)
* L = 3: Approximately 4.6 (Answer Coverage)
* L = 4: Approximately 4.4 (Answer Coverage)
*Trend:* The Precision increases slightly from L=1 to L=2, then decreases gradually from L=2 to L=4.
**Recall (Dotted Orange Line):**
* L = 1: Approximately 6.4 (Answer Coverage)
* L = 2: Approximately 7.4 (Answer Coverage)
* L = 3: Approximately 6.8 (Answer Coverage)
* L = 4: Approximately 6.6 (Answer Coverage)
*Trend:* The Recall increases slightly from L=1 to L=2, then decreases gradually from L=2 to L=4.
**F1 Score (Blue Dashed Line):**
* L = 1: Approximately 1.2 (Answer Coverage)
* L = 2: Approximately 3.4 (Answer Coverage)
* L = 3: Approximately 3.6 (Answer Coverage)
* L = 4: Approximately 3.8 (Answer Coverage)
*Trend:* The F1 score increases steadily with increasing path length *L*.
### Key Observations
* The KG-Trie size grows rapidly with increasing path length.
* The Hit rate plateaus after L=2, suggesting diminishing returns in terms of answer retrieval with longer paths.
* Precision and Recall both decrease slightly after L=2, indicating a potential trade-off between coverage and accuracy.
* The F1 score, which balances precision and recall, shows a consistent increase with path length, but at a decreasing rate after L=2.
### Interpretation
The chart demonstrates the relationship between KG-Trie path length and performance metrics. Increasing the path length *L* initially improves the Hit rate and F1 score, but also leads to a significant increase in the KG-Trie size. Beyond a certain path length (around L=2 in this case), the gains in performance become marginal, while the memory footprint continues to grow. This suggests an optimal path length exists, balancing performance and resource usage. The plateauing of the Hit rate and the slight decrease in Precision and Recall after L=2 indicate that longer paths may introduce noise or redundancy, potentially degrading the quality of the retrieved answers. The data suggests that for this specific KG-Trie implementation, a path length of 2 or 3 might represent a good compromise between performance and efficiency. The chart highlights the importance of carefully tuning the path length parameter to optimize the KG-Trie system for a given application.