## Dual-Axis Combination Chart: KG-Trie Performance Metrics vs. Path Length
### Overview
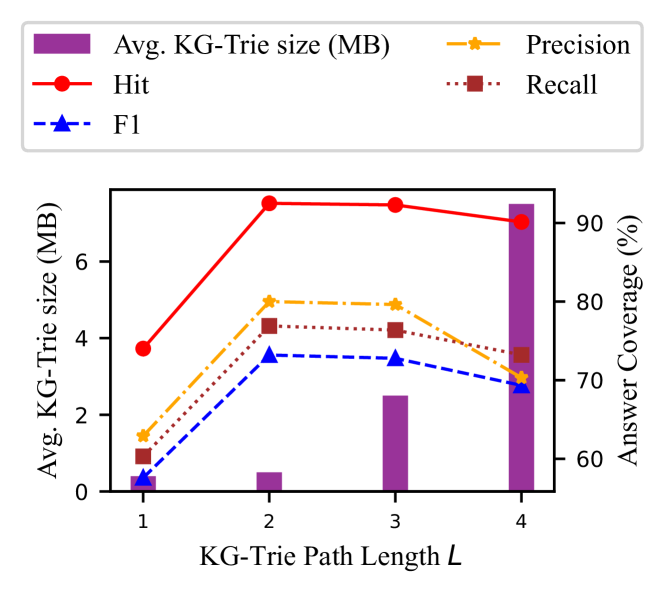
This is a dual-axis combination chart that plots five performance metrics for a "KG-Trie" system against the path length parameter `L`. The chart uses bars for one metric (memory size) and lines with distinct markers for four other metrics (Hit, F1, Precision, Recall), allowing for comparison of trends across different scales.
### Components/Axes
* **X-Axis (Bottom):** Labeled "KG-Trie Path Length L". It has four discrete, evenly spaced categories: `1`, `2`, `3`, and `4`.
* **Primary Y-Axis (Left):** Labeled "Avg. KG-Trie size (MB)". The scale runs from 0 to approximately 7.5, with major ticks at 0, 2, 4, and 6. This axis corresponds to the purple bar series.
* **Secondary Y-Axis (Right):** Labeled "Answer Coverage (%)". The scale runs from 60 to 90, with major ticks at 60, 70, 80, and 90. This axis corresponds to the four line series (Hit, F1, Precision, Recall).
* **Legend (Top, Centered):** Contains five entries, each with a distinct color and marker:
1. **Purple Bar:** "Avg. KG-Trie size (MB)"
2. **Red Solid Line with Circle Marker:** "Hit"
3. **Blue Dashed Line with Triangle Marker:** "F1"
4. **Orange Dash-Dot Line with Star Marker:** "Precision"
5. **Brown Dotted Line with Square Marker:** "Recall"
### Detailed Analysis
Data points are approximate, read from the chart's visual alignment with the axes.
**1. Avg. KG-Trie size (MB) - Purple Bars (Left Axis):**
* **Trend:** Increases monotonically and sharply with path length L.
* **Values:**
* L=1: ~0.1 MB
* L=2: ~0.5 MB
* L=3: ~2.5 MB
* L=4: ~7.5 MB
**2. Hit (%) - Red Line, Circle Markers (Right Axis):**
* **Trend:** Increases sharply from L=1 to L=2, plateaus at L=2 and L=3, then decreases slightly at L=4.
* **Values:**
* L=1: ~68%
* L=2: ~93%
* L=3: ~93%
* L=4: ~90%
**3. Precision (%) - Orange Line, Star Markers (Right Axis):**
* **Trend:** Increases from L=1 to L=2, remains stable at L=3, then decreases at L=4.
* **Values:**
* L=1: ~64%
* L=2: ~80%
* L=3: ~80%
* L=4: ~72%
**4. Recall (%) - Brown Line, Square Markers (Right Axis):**
* **Trend:** Increases from L=1 to L=2, remains stable at L=3, then decreases at L=4.
* **Values:**
* L=1: ~61%
* L=2: ~77%
* L=3: ~77%
* L=4: ~73%
**5. F1 (%) - Blue Dashed Line, Triangle Markers (Right Axis):**
* **Trend:** Increases from L=1 to L=2, remains stable at L=3, then decreases at L=4.
* **Values:**
* L=1: ~58%
* L=2: ~74%
* L=3: ~74%
* L=4: ~70%
### Key Observations
1. **Performance Plateau:** All four answer coverage metrics (Hit, Precision, Recall, F1) show a significant improvement from L=1 to L=2, then plateau at L=2 and L=3. This suggests that increasing the path length from 1 to 2 provides the most substantial benefit.
2. **Diminishing Returns & Cost:** At L=4, all performance metrics (Hit, Precision, Recall, F1) decline compared to their peak at L=2/L=3. Concurrently, the average KG-Trie size (memory cost) increases dramatically, more than tripling from L=3 to L=4.
3. **Metric Hierarchy:** The "Hit" rate is consistently the highest-performing metric, followed by Precision, then Recall, with F1 being the lowest. This ordering is maintained across all path lengths.
4. **Memory Growth:** The memory footprint (Avg. KG-Trie size) exhibits what appears to be exponential or super-linear growth with path length L.
### Interpretation
The chart demonstrates a clear trade-off in the KG-Trie system design. Increasing the path length parameter `L` from 1 to 2 yields major gains in answer coverage across all metrics, indicating that longer paths are necessary for effective retrieval. However, the benefits saturate at `L=2` and `L=3`.
The critical insight is the **inefficiency at L=4**. The system incurs a massive increase in memory cost (from ~2.5 MB to ~7.5 MB) while simultaneously suffering a degradation in all performance metrics. This suggests that a path length of 4 introduces noise, over-specialization, or computational overhead that harms effectiveness without providing a coverage benefit. The optimal operating point appears to be `L=2` or `L=3`, where performance is maximized before the severe cost-benefit penalty at `L=4`. The data argues against using a path length of 4 for this system configuration.